Description
Overview
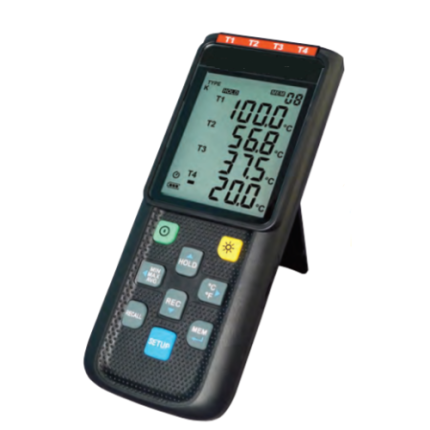
GAOTek Thermocouple Thermometer with K/J/E/T Types (Data Logger) is designed by input isolation protection upto 250 V AC and built-in Data Logger function which holds 16,000 records in each channel. It provides large backlit LCD screen helps the users to read the data in any environment. The data logger function offers the users to collect temperature data and download to PC for software analysis. It provides data hold function and MAX/MIN/AVG function as some of its main features. This thermocouple thermometer consumes low power with auto power off function.
Key Features
- Four channel reading LCD display
- Support K, J, E, T type thermocouple probe
- Min/Max/Avg function
- Large backlit LCD
- Data Hold function
- 16,000 Records Data Logger
- PC Interface with Windows software
- Auto power off for battery saving
- Isolated input protection up to 250 V AC between any two inputs
Technical Specifications
| Measurement Range | -328 °F ~ 2498 °F (-200 °C ~ 1370 °C) |
| Accuracy | ± 0.1 % rdg + 1.4 °F , ± 0.1% rdg + 0.7 °C |
| Sample Rate | 1 time/second |
| Resolution | 0.1 °F, 0.1 °C |
| Input Protection | 250 V AC |
| Battery Type | 9 V battery |
| AC Adapter | 9 V DC ( 8-10 V DC Max ) |
| Dimension | 7.75 in x 2.56 in x 1.42 in (197 mm x 65 mm x 36 mm) |
| Weight | 10.93 oz. (310 g) |
| Operating Humidity | 10 % to 90 % |
| Storage Humidity | 10 % to 75 % |
| Operating Temperature | 32 °F ~ 122 °F (0 °C ~ 50 °C) |
| Storage Temperature | -4 °F ~ 140 °F (-20 °C ~ 60 °C) |
Additional Information:
Standard Accessories:
- K Type Bead Probe -2 pieces
- USB Cable
- 9 V Battery
- Windows Software
- User manual
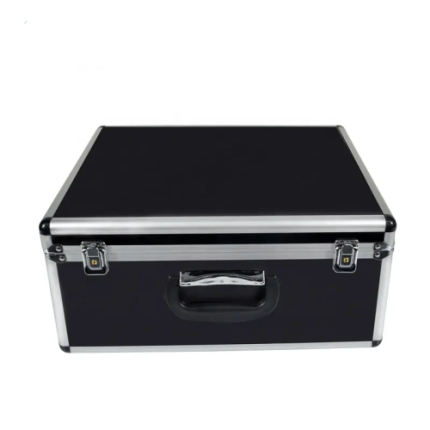
- Carrying Case
Optional Accessories:
- AC/DC Adapter
Symbol Definition and Button location:

| |
Battery condition indicator |
| MIN | Minimum indicator |
| MAX | Maximum indicator |
| AVG | Average indicator |
| |
This indicates Auto Power Off is enabled |
| REC | Recording data logger indicator |
| FULL | Memory full indicator |
| K.J.E.T | Thermocouple type |
| 188.8 | Temperature reading |
| °C °F | Temperature measurement units |
| H | Data hold indication |

①Thermocouple Input
②Display Screen
③Power ON/OFF Button and Back Light Button
④REC Button
⑤T1-T2 Button
⑥ MAX MIN AVG Button
⑦DATA HOLD Button
⑧°C, °F Button
⑨PC Interface
⑩External DC 9V power supply jack
⑪Tilt Stand
⑫ Battery Compartment
OPERATION INSTRUCTIONS
Power ON/OFF & Backlight Operation:
Power on/off:
Press the ![]() button to turn on the meter. To turn the unit off, press and hold
button to turn on the meter. To turn the unit off, press and hold ![]() button down until the screen shows “OFF 3, 2, 1,” then the LCD screen goes off.
button down until the screen shows “OFF 3, 2, 1,” then the LCD screen goes off.
Note: When the unit is on, the LCD will show the following initial information before entering the main function: Offset setting à Current date/time à Available memory à Entering main function. (If all offset is set to zero, offset will not be shown)
LCD backlight on/off:
Press ![]() to turn on the LCD backlight. This makes it easier to read in dark environment. Press again
to turn on the LCD backlight. This makes it easier to read in dark environment. Press again![]() to turn off backlight. The meter can also turn the backlight off automatically after 30 seconds to save battery power.
to turn off backlight. The meter can also turn the backlight off automatically after 30 seconds to save battery power.
Auto power off:
To save battery life, by default, every time the unit is powered on, it is under auto power off mode. The unit will power itself off after 30 minutes if there is no key operation. Auto power off will be automatically disabled under the following 2 situations:
- When connecting to PC.
- When data logger function is in process.
Disabled auto power off:
- Turn off the unit.
- Press and hold the “HOLD”
- Press
 to turn on the unit.
 - The LCD shows the initial information and then enters main function.
- Release “HOLD”
- Make sure the auto power off
 symbol disappears from display screen.
REC button:
Press “REC” button to start recording data. The REC symbol will display on the screen. To stop recording, press “REC” button again.
T1-T2 button:
Push this key to display T1-T2 at the 3rd column on LCD


MAX/MIN mode (only for channel T1):
Under this mode, the unit simultaneously monitors and stores the maximum, minimum and average value in the memory. The unit will keep updating/refreshing the data.
To start:
- Press “MIN/MAX” MAX symbol lights up on LCD, the reading shows the maximum data.
- Press “MIN/MAX” button again to show minimum data; the MIN symbol lights up on LCD.
- Press “MIN/MAX” button again to show average data; the AVG symbol lights up on LCD.
- Press “MIN/MAX” button again, the MAX and MIN symbol blinks together. The reading shows present T1 temperature.
- Press button again, will circular the whole process again.
To exit MAX/MIN mode:
Press and hold “MIN/MAX” button for 2 seconds to exit MAX/MIN mode.
Note: When the unit is under MAX/MIN mode, “HOLD”, “T1-T2” and “°C°F”, buttons are disabled.
Data-Hold mode
Press “HOLD” button to freeze the data shows on the LCD screen. Press it again to exit Data-Hold mode. Note: When the unit is in the Data-Hold mode, “MIN/MAX”, “T1-T2” and “°C°F”, buttons are disabled.
Selecting temperature units:
Press the “°C°F” button to switch between Celsius (°C) and Fahrenheit (°F).
Connecting to a computer:
The meter can be connected to PC through USB cable (standard accessory) to connect with a computer. There is also RS-232 cable available and user can purchase it separately.
External DC 9V power supply jack:
Connect the AC/DC adapter (optional accessory) to use external power.
Using the offset to compensate for probe errors:
The user can adjust the readings of thermometer to compensate for the errors against a specific thermocouple.
- Plug the thermocouple into a desired input terminal (T1 ~ T4).
- Turn off the unit.
- Enter offset setting mode by pressing and holding (“T1-T2”) button and then press power button to turn on the unit.

- The upper reading is the current reading with offset and the lower reading is the offset which can be adjusted.
- Press “REC” to select corresponding input terminal (T1 ~ T4).
- Place the thermocouple in a known stable temperature environment (such as an ice bath or a dry well calibrator).
- Allow the readings to stabilize.
- Press ▲ (“T1-T2”) or ▼ (“°C°F”) to adjust value.
- When finish, press “MIN/MAX” button to store and exit offset setting mode.
Note: To abort setting process, press power button to exit offset setting mode.
How to display offset value:
Under normal mode, press “HOLD” button for more than 1 second to display offset value. Release the button will go back to normal mode.

Select thermocouple type: K, J, E, or T
- Power off the meter first. Press and hold “MIN/MAX” button, then press button to power on and enter setting mode. Release all buttons, the LCD blinks “SEt.”
- Press ▼ (“°C°F”) button to Selecting Thermocouple type

- Press ▲ (“T1-T2”) to select from K, J, E, or T type thermocouple.
- When done, press ▼ (“°C°F”) button to exit settingNote: During the setting process, press button anytime to cancel and exit mode .
DATA LOGGER
This section will explain how to store data (data logger) in memory and how to recall data from memory.
Setting interval time for data storing:
- Turn off the unit.
- Enter SETUP mode by pressing and holding “MIN/MAX” button and then press power button to turn on the unit. “SEt” blinks on the LCD screen.

- Press “HOLD” button to set storing interval.

- Press ▲ (“T1-T2”) or ▼ (“°C°F”) to adjust the minute, press “HOLD” button again to adjust second.
- When finished, press “HOLD” button to exit SETUP mode.
Note:
To abort during the process, press power button to exit SETUP mode.
Start data logger (storing data in the memory):
- Press (“REC”) button to start data logger (storing the measured values in built-in memory).
- REC symbol lights up on LCD screen.
- Press (“REC”) button again to stop recording.
Note: During recording period, most of the buttons are disabled, such as the (“T1-T2”), ▼ (“°C°F”) etc. All other settings must be made before starting the data logger function.
Note: When the memory is full (16000 recorders), FULL symbol will blink on the LCD screen. The data logger stops. Note: When battery power is low (![]() symbol lights up on the screen), data logger cannot be started. If during data logger, the battery starts running low, data logger will stop automatically.
symbol lights up on the screen), data logger cannot be started. If during data logger, the battery starts running low, data logger will stop automatically.
Clearing Data:
- Turn off the unit.
- Press and hold “REC” button and then press power button to turn on the unit.
- Keep holding “REC” button, then LCD will show “CLr” and “SUrE 5, 4…1, 0” until clean the memory. (To abort, release “REC” button before “SUrE 0”.)
SETTING DATE AND TIME
The unit incorporates a clock so that the data logger function can also record the data and time along with the measurement value in the memory.
Setting date and time:
- Turn off the unit.
- Enter SETUP mode by pressing and holding button and then press power button to turn on the unit. “SEt” blinks on the LCD screen.
- Press CLOCK (“REC”) button to set clock.
- Press ▲ (“T1-T2”) or ▼ (“°C°F”) to adjust year, press CLOCK (“REC”) button to adjust next value (month→ date→hour →minute)

- When finish, press CLOCK (“REC”) button to exit SETUP mode.
Note: To abort during the process, press power button to exit SETUP mode.
Note: An internal backup battery supplies power for the clock.
POWER PREPARATION
Battery Loading:
Remove the battery cover on the back and insert one 9 V battery.

Battery capacity indicator:
When operating the unit on batteries, periodically check this indicator to determine the remaining battery capacity.

AC Adapter Connection:
When the AC adapter is used, insert the plugs of the adapter into the DC 9 V connector on the side panel. Note: When the AC adapter is connected while battery is inserted, the unit will be powered from the adapter (the AC adapter has priority).
Test link Software:
The package contains:
- Software CD disk
- Custom designed USB cable
System Required:
Windows NT 4.0/ NT2000/XP/ VISTA/ Windows 7/ Windows 8/ Windows
Minimum Hardware Required:
- PC or Notebook with Pentium 800MHz or higher, 512 MB RAM
- At least 50 MB hard disk space available to install this package.
- Recommended screen resolution 1024X768 or above.
Install the package and USB connector driver:
- We recommend close all other application before installing the package.
- Insert setup CD disk to CD disk drive to display install screen. You may also run mainsetup.exe in the directory of the CD.
- Click Install to begin installation.
- It will install USB connector driver first.
- While installing, it will display the window, just click “next” to continue
- Select “Launch the Driver Installer” option, then click Finish
- After finish installing USB connector driver, it will install the package software automatically. It will copy the executable file and help file to your hard disk (default location is c:program files…)
- After finish installation, plug USB connector to PC USB port, execute “start” à”My Computer”, then choose “View System Information” on the left top of the window, the window will show up.
- Choose “Hardware” option and click “Device Manager” button, click “+” symbol on the left side of Ports (COM &LPT), if the device “USB to UART Bridge Controller (COMx)” is in the list, the connector is ready to work.
Tutorial – Quick Start to use:
Recording real time data in waveform:
- Power on the 4 Channel Thermometer first and connect it to a PC USB port with the cable
- Start the program.
- If the connection is successful the panel will display the same value as the 4 Channel Thermometer. If fail to connect the meter with PC, it will display “No Connection” on the panel window

- Select sampling rate from Real-Time Graph window

Note: If PC speed is slow, select sampling rate above 1 second. And if it is going to sample a large amount data (more than 5000), at least 512 megabytes ram is recommended to keep PC running in good performance working well. - When the connection is successful, click “Real Time | run” or
 from main menu to start recording real time data and there will be a waveform on the Real Time Graph Window.
 - Click “Real Time | Stop” or
 to stop recording.
How to save the recorded real time data to a file?
- Click the graph window you want to save and the graph window will become active, then choose File | Save from main menu or click from the tool bar.
- There will be a save dialog window for you to choose the file name and file type to save. There are three types of file format you can choose, binary file (*.ghf), text file (*.txt) and EXCEL format file (*.csv). The *.ghf file use much fewer disk space to save the data than the other two file formats, but it can only be used in this package. Text file can be opened by this package and any other word processor program like word, notepad etc. EXCEL format file can be opened by this package and Microsoft EXCEL.
Note: If decimal separator is comma in your country, this file format will be disabled, because .CSV file also use comma to be data separator.
How to load the recorded data from the memory of 4 Channel Thermometer and save it to a file?
- Power on the 4 Channel Thermometer.
- Press the “REC” button of the meter to start recording data.
- After a while, press “REC” button again to stop recording data.
- Connect the Meter to PC
- Start the program.
- Choose Data Logger from main menu or click
 from tool bar.

- In reference to Data Logger, see DataLogger
Main menu:

![]() File | Open– Retrieve files from the disk.
File | Open– Retrieve files from the disk.
![]() Save – Save the active window (when the caption bar is highlighted) data to the disk.
Save – Save the active window (when the caption bar is highlighted) data to the disk.
![]() Print – Print the data of the active window (graph or list).
Print – Print the data of the active window (graph or list).
![]() Real Time Data | Run – Start collecting real time data.
Real Time Data | Run – Start collecting real time data.
![]() Stop – Stop collecting real time data.
Stop – Stop collecting real time data.
![]() DataLogger:By opening the DataLogger Window, the user can load recorded data of meter to PC in this window.
DataLogger:By opening the DataLogger Window, the user can load recorded data of meter to PC in this window.
![]() Output To Graph – Graphing tabular data.
Output To Graph – Graphing tabular data.
Printer Setup – Select printer.
File | Exit: Terminates program.
View | Control Panel: By opening the Panel Window, the user can control meter via the button in this window.
View | Real-Time Graph: Open Real-Time Graph display to graph the present data.
DataLogger:

When you have the thermometer connected to PC, select “DataLogger” from main menu or click Datalogger icon from tool bar to load recorded data from the meter and there will be a progress indicator to show the loading status. If error occurs, just click “DataLogger icon” again.
After the data was downloaded, the left hand side will show how many data sets were loaded and detail information for each data set (start data, start time, recording rate and record numbers).
For Example:

It will transfer first data set to graph on the right hand side. The user can also click at any other data set to choose that set for graph.
Graph:

Toolbar:
![]() – Display or hide Statistic1.
– Display or hide Statistic1.
![]() – Display or hide Statistic2.
– Display or hide Statistic2.
![]() – Normal cursor.
– Normal cursor.
![]() – When selected, the mouse cursor will become a cross sign when moving to the graph, click on the graph to mark a cross sign on the graph. This is available only when “Split” option is unchecked. And all the mark you make will exist with T1.
– When selected, the mouse cursor will become a cross sign when moving to the graph, click on the graph to mark a cross sign on the graph. This is available only when “Split” option is unchecked. And all the mark you make will exist with T1.
![]() – When selected, the mouse cursor will become an “I” sign when moving to the graph, click on the graph to annotate. This is available only when “Split” option is unchecked. And all the text you make will exist with T1.
– When selected, the mouse cursor will become an “I” sign when moving to the graph, click on the graph to annotate. This is available only when “Split” option is unchecked. And all the text you make will exist with T1.
![]() Separate the four channel.
Separate the four channel.

![]() Combine the four channel.
Combine the four channel.

![]() – Graph Customization
– Graph Customization
![]() – Change the Y axis extension.
– Change the Y axis extension.

Note: When the Split is unchecked, graph will use T1 as the Y axis display range.
![]() – To Undo the Zoom
– To Undo the Zoom
You can zoom this graph by using mouse:
To Zoom:
- Press the left mouse button and drag the cursor to select the new extents.
- Release the mouse button.
You can choose channel number showing in the graph.
- Click “Graph Option” to call Customization dialog.
- Select Subsets tab.
- Select a single channel or multiselect (hold Ctrl key, use mouse to choose) channels.