

GAOTek Smart Digital Oscilloscope (Bandwidth 60 MHz~300 MHz, Sample Rate 500 MS/s~3.2 GS/s)
This Smart Digital Oscilloscope (Bandwidth 60 MHz~300 MHz, Sample Rate 500 MS/s~3.2 GS/s) is a dual channel deep memory digital storage oscilloscope and each channel has the record length upto 10 M points.
| Model Variations |
GAO-DSO-102A 60MHz ,GAO-DSO-102B 70MHz ,GAO-DSO-102C 100MHz ,GAO-DSO-102D 100MHz ,GAO-DSO-102E 200Mhz ,GAO-DSO-102F 200MHz ,GAO-DSO-102G 300MHz ,GAO-DSO-102H 300MHz |
|---|
Description
Overview
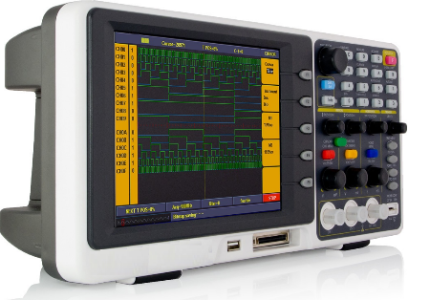
GAOTek Smart Digital Oscilloscope (Bandwidth 60 MHz~300 MHz, Sample Rate 500 MS/s~3.2 GS/s) is a dual channel deep memory digital storage oscilloscope and each channel has the record length upto 10 M points. It operates with the bandwidth of 60 MHz~300 MHz and a high sampling rate of 500 MS/s~3.2 GS/s. It has other features like advanced triggering, three math functions and FFT, 20 automatic measurements, auto-scale function, pass/fail testing, a VGA port, and USB connectivity. The high sample rate and deep memory enable long capture times for processing and displaying detailed waveform. This smartly designed oscilloscope is portable and has an 8 inch high definition TFT display (800 × 600 pixels).
| Model | Bandwidth | Sample rate | Record length | LCD | Price USD |
| GAO-DSO-102A | 60MHz | 500MSa/s | 10M | 8 inch | 550.00 |
| GAO-DSO-102B | 70MHz | 1GSa/s | 10M | 8 inch | 580.00 |
| GAO-DSO-102C | 100MHz | 1GSa/s | 10M | 8 inch | 590.00 |
| GAO-DSO-102D | 100MHz | 2GSa/s | 10M | 8 inch | 720.00 |
| GAO-DSO-102E | 200MHz | 1GSa/s | 10M | 8 inch | 680.00 |
| GAO-DSO-102F | 200MHz | 2GSa/s | 10M | 8 inch | 870.00 |
| GAO-DSO-102G | 300MHz | 2.5GSa/s | 10M | 8 inch | 1090.00 |
| GAO-DSO-102H | 300MHz | 3.2GSa/s | 10M | 8 inch | 1280.00 |
Key Features
- Bandwidth: 60 MHz ~ 300 MHz
- Sample rate (real time): 500 MS/s ~ 3.2 GS/s
- Dual channel, 10 M points on each channel for the Record length
- Autoscale function
- 75 in (7 cm) smart design body
- 8 in high definition TFT display (800 × 600 pixels)
- Built-in FFT function
- Pass/Fail Function
- Waveform record and playback
- Various triggering function
- USB communication ports
- Super capacity lithium battery (Optional)
- Multiple language support
Technical Specifications
| Bandwidth | 60 MHz | 70 MHz | 100 MHz | 200 MHz | 300 MHz | |
| Rise Time | ≤5.8 ns | ≤5 ns | ≤3.5 ns | ≤1.7 ns | ≤1.17 ns | |
| Sample Rate | 500 MS/s ~ 3.2 GS/s | |||||
| Display | 8” color LCD, 800 x 600 pixels, 65535 colors | |||||
| Channel | 2 + 1 (external) | |||||
| Record Length | Max 10 M | |||||
| Input Coupling | DC, AC, and GND | |||||
| Input Impedance | 1 MΩ ± 2%, in parallel with 15 pF ± 5 pF | |||||
| Channel Isolation | 50 MHz : 100 : 1, 10 MHz : 40 : 1 | |||||
| Max Input
Voltage |
400 V (PK – PK) (DC + AC, PK – PK) | |||||
| DC Gain Accuracy | ±3% | |||||
| DC Accuracy | average≥16: ± (3% reading + 0.05 div) for ΔV | |||||
| Probe Attenuation Factor | 1X, 10X, 100X, 1000X | |||||
| LF Respond (AC, -3dB) | ≥10 Hz (at input, AC coupling, -3 dB) | |||||
| Sampling Rate/Relay Time Accuracy | ±100 ppm | |||||
| Interpolation | sin (x) / x | |||||
| Interval (ΔT) Accuracy (full bandwidth) | Single:± (1 interval time + 100 ppm × reading + 0.6ns); Average>16: ± (1 interval time + 100 ppm × reading + 0.4 ns) |
|||||
| Vertical Resolution (A/D) | 8 bits resolution (2 channels simultaneously) | |||||
| Vertical Sensitivity | 2 mV/div~10 V/div | |||||
| Trigger Type | Edge, Pulse, Video, Slope, Alternate | |||||
| Trigger Mode | Auto, Normal, Single | |||||
| Trigger Level | ±6 divisions from screen center | |||||
| Acquisition modes | Sample, Peak Detect, and Average | |||||
| Line/Field Frequency (video) | NTSC, PAL and SECAM standard | |||||
| Cursor Measurement | ΔV, and ΔT between cursors | |||||
| Automatic Measurement | Vpp, Vavg, Vamp, Vrms, Freq, Period, Vmax, Vmin, Vtop, Vbase, Overshoot, Preshoot, Rise Time, Fall Time, Delay A→B↑, Delay A→B↓, +Width, -Width, +Duty, -Duty | |||||
| Waveform Math | +, -, ×, ÷, FFT | |||||
| Waveform Storage | +, -, ×, ÷, FFT | |||||
| Lissajous Figure | Bandwidth | full bandwidth | ||||
| Phase Difference | ±3 degrees | |||||
| Communication Interface | USB, USB flash disk storage, Pass / Fail, LAN, VGA (optional), or COM (optional) | |||||
| Cymometer | available | |||||
| Power Supply | 100 V – 240 V AC, 50/60Hz, CAT Ⅱ | |||||
| Power Consumption | < 24 W | |||||
| Fuse | 2 A, T class, 250 V | |||||
| Battery (optional) | 7.4 V, 8000 mA | |||||
| Dimension (W × H × D) | 13.38 in × 6.10 in × 2.75 in (340 mm × 155 mm × 70 mm) | |||||
| Weight (without package) | 3.96 lbs (1.80 kg) | |||||
Additional Information
Ordering Information
| Model No. | Bandwidth | Sample Rate | Record Length | Channel |
| GAO-DSO-102A | 60 MHz | 500 MS/s |
10 M |
2+1 |
| GAO-DSO-102B | 70 MHz | 1 GS/s | ||
| GAO-DSO-102C | 100 MHz | 1 GS/s | ||
| GAO-DSO-102D | 100 MHz | 2 GS/s | ||
| GAO-DSO-102E | 200 MHz | 1 GS/s | ||
| GAO-DSO-102F | 200 MHz | 2 GS/s | ||
| GAO-DSO-102G | 300 MHz | 2.5 GS/s | ||
| GAO-DSO-102H | 300 MHz | 3.2 GS/s |
Standard Accessories
| Passive probe: 1.2 m, 1:1 (10:1) | Pair |
| CD (PC link application software) | 1 pc |
| Power cord: up to the standards of the country in which it is used | 1 |
| USB Cable | 1 |
| Quick Guide | 1 |
Applications
- Electronic circuit debugging
- Circuit testing
- Design and manufacture
- Automobile maintenance and testing
- Education and training
Introduction to the Structure of the Oscilloscope
Front Panel
The GAOTek Smart Digital Oscilloscope offers a simple front panel with distinct functions to users for their completing some basic operations, in which the knobs and function push buttons are included. The knobs have the functions similar to other oscilloscopes. The 5 buttons (F1 ~ F5) in the column on the right side of the display screen or in the row under the display screen (H1 ~ H5) are menu selection buttons, through which, you can set the different options for the current menu. The other push buttons are function buttons, through which, you can enter different function menus or obtain a specific function application directly.

- Power on/off
- Display area
- Power indication– light
Green light: Indicating DSO connects with AC Power, and the battery is in full (if there is battery inside DSO).
Yellow light: Indicating DSO connect with AC Power and the battery is in charging (if there is battery inside DSO)
Light off: Only powered by battery without connecting AC Power
- Control (key and knob) area
- Probe Compensation: Measurement signal (5V/1KHz) output.
- EXT Trigger Input
- Signal Input Channel
- Menu off
Left Side Panel

- Power switch: “―” represents power ON; “○” represents power OFF.
- AC power input jack
Right Side Panel

- USB Host port: It is used to transfer data when external USB equipment connects to the oscilloscope regarded as “host device”. For example: upgrading software by USB flash disk needs to use this port.
- USB Device port: It is used to transfer data when external USB equipment connects to the oscilloscope regarded as “slave device”. For example: to use this port when connect PC to the oscilloscope by USB.
- COM / VGA port (Optional): To connect the oscilloscope with external equipment as serial port, or to connect the oscilloscope with a monitor or a projector as VGA output (for the model with “V”).
- LAN port: the network port which can be used to connect with PC.
Rear Panel

- The port of trigger signal output & Pass/Fail output
- Handle
- Air vents
- Foot stool (which can adjust the tilt angle of the oscilloscope)
- Ground connection
Control (key and knob) Area

- Menu option setting: H1~H5
- Menu option setting: F1~F5
- Menu off: turn off the menu
- M knob (Multipurpose knob): when a
 symbol appears in the menu, it indicates you can turn the M knob to select the menu or set the value. You can press it to close the menu on the left.
 - Function key area: Total 12 keys
- Vertical control area with 3 keys and 4 knobs. “CH1 MENU” and “CH2 MENU” correspond to setting menu in CH1 and CH2, “Math” key refer to math menu, the math menu consists of six kinds of operations, including CH1-CH2, CH2-CH1, CH1+CH2, CH1*CH2, CH1/CH2 and FFT. Two “VERTICAL POSITION” knob control the vertical position of CH1/CH2, and two “VOLTS/DIV” knob control voltage scale of CH1, CH2.
- Horizontal control area with 1 key and 2 knobs. “HORIZONTAL POSITION” knob control trigger position, “SEC/DIV” control time base, “HORIZ MENU” key refer to horizontal system setting menu.
- Trigger control area with 3 keys and 1 knob. “TRIG LEVEL” knob is to adjust trigger voltage. Other 3 keys refer to trigger system setting.
User Interface Introduction

- Waveform Display Area.
- The state of trigger, including: Auto: Automatic mode and acquire waveform without triggering. Trig: Trigger detected and acquire waveform. Ready: Pre-triggered data captured and ready for a trigger. Scan: Capture and display the waveform continuously. Stop: Data acquisition stopped.
- The purple T pointer indicates the horizontal position for the trigger.
- The pointer indicates the trigger position in the internal memory.
- The two yellow dotted lines indicate the size of the viewing expanded window.
- It shows present triggering value and displays the site of present window in internal memory.
- It shows setting time.
- It indicates that there is a U disk connecting with the oscilloscope.
- Indicating battery power status.
- The red pointer shows the trigger level position for CH1.
- The waveform of CH1.
- The positions of two purple dotted line cursors measurements.
- The yellow pointer shows the trigger level position for CH2.
- The waveform of CH2.
- The frequency of the trigger signal of CH1.
- The frequency of the trigger signal of CH2.
- It indicates the current function menu.
- /19. Current trigger type: Rising edge triggering Falling edge triggering Video line synchronous triggering Video field synchronous triggering The reading shows the trigger level value of the corresponding channel.
- The reading shows the window time base value.
- The reading shows the setting of main time base.
- The readings show current sample rate and the record length.
- It indicates the measured type and value of the corresponding channel. “F” means frequency, “T” means cycle, “V” means the average value, “Vp” the peak-peak value, “Vk” the root-mean-square value, “Ma” the maximum amplitude value, “Mi” the minimum amplitude value, “Vt” the Voltage value of the waveform’s flat top value, “Vb” the Voltage value of the waveform’s flat base, “Va” the amplitude value, “Os” the overshoot value, “Ps” the Preshoot value, “RT” the rise time value, “FT” the fall time value, “PW” the +width value, “NW” the -Width value, “+D” the +Duty value, “-D” the -Duty value, “PD” the Delay A B value and “ND”the Delay A B value.
- The readings indicate the corresponding Voltage Division and the Zero Point positions of the channels. The icon shows the coupling mode of the channel. “—” indicates direct current coupling “~” indicates AC coupling ” ” indicates GND coupling
- It is cursor measure window, showing the absolute values and the readings of the two cursors. 26. The yellow pointer shows the grounding datum point (zero point position) of the waveform of the CH2 channel. If the pointer is not displayed, it shows that this channel is not opened.
- The red pointer indicates the grounding datum point (zero point position) of the waveform of the CH1 channel. If the pointer is not displayed, it shows that the channel is not opened.
How to Implement the Function Inspection
Make a fast function check to verify the normal operation of the instrument, according to the following steps:
- Connect the power cord to a power source.
Turn on the Power Switch Button on the left side (make sure the “―” side is pressed down). Then, push down the button of the “
 ” signal on the top.
The instrument carries out all self-check items and shows the Boot Logo. Press the “Utility” button, then, press H1 button to get access to the “Function” menu. Turn the M knob to select Adjust and press H3 button to select “Default”. The default attenuation coefficient set value of the probe in the menu is 10X.
- Set the Switch in the Oscilloscope Probe as 10X and Connect the Oscilloscope with CH1 Channel.
Align the slot in the probe with the plug in the CH1 connector BNC, and then tighten the probe with rotating it to the right side.
Connect the probe tip and the ground clamp to the connector of the probe compensator. - Press the “Autoset” Button.
The square wave of 1 KHz frequency and 5 V peak-peak value will be displayed in several seconds

Check CH2 by repeating Step 2 and Step 3.
Troubleshooting
Oscilloscope is powered on but no Display.
- Check whether the power connection is connected properly.
- Check whether the power switch is pushed down to the designated position.
- Check whether the fuse which is beside the AC power input jack is blew (the cover can be pried open with a straight screwdriver).
- Restart the instrument after completing the checks above.
After acquiring the signal, the waveform of the signal is not displayed in the screen.
- Check whether the probe is properly connected to the signal connecting wire.
- Check whether the signal connecting wire is correctly connected to the BNC (namely, the channel connector).
- Check whether the probe is properly connected with the object to be measured.
- Check whether there is any signal generated from the object to be measured (the trouble can be shot by the connection of the channel from which there is a signal generated with the channel in fault).
- Make the signal acquisition operation again.
The measured voltage amplitude value is 10 times or 1/10 of the actual value.
Look at the attenuation coefficient for the input channel and the attenuation ration of the probe, to make sure they are match.
There is a waveform displayed, but it is not stable.
- Check whether the Source item in the TRIG MODE menu is in conformity with the signal channel used in the practical application.
- Check on the trigger Type item: The common signal chooses the Edge trigger mode for Type and the video signal the Video. If Alternate trigger is selected, both of the channel 1 and channel 2 trigger levels should be adjusted to the proper position. Only if a proper trigger mode is applied, the waveform can be displayed steadily.
- Try to change the trigger coupling into the high frequency suppress and the low frequency suppress to smooth the high frequency or low frequency noise triggered by the interference.
No Display Responses to the Push-down of Run/Stop.
Check whether Normal or Signal is chosen for Polarity in the TRIG MODE menu and the trigger level exceeds the waveform range.
If it is, make the trigger level is centered in the screen or set the trigger mode as Auto. In addition, with the Autoset button pressed, the setting above can be completed automatically.
The displaying of waveform seems getting slow after increasing AVERAGE value in Acqu Mode, or a longer duration is set in the Persist in Display.
It’s normal as the Oscilloscope is working hard on many more data points.
General Care and Cleaning
General Care
Do not store or leave the instrument where the liquid crystal display will be exposed to direct sunlight for long periods of time.
Caution: To avoid any damage to the instrument or probe, do not exposes it to any sprays, liquids, or solvents.
Cleaning
Inspect the instrument and probes as often as operating conditions require. To clean the instrument exterior, perform the following steps:
- Wipe the dust from the instrument and probe surface with a soft cloth. Do not make any scuffing on the transparent LCD protection screen when cleaning the LCD screen.
- Disconnect power before cleaning your Oscilloscope. Clean the instrument with a wet soft cloth not dripping water. It is recommended to scrub with soft detergent or fresh water. To avoid damage to the instrument or probe, do not use any corrosive chemical cleaning agent.