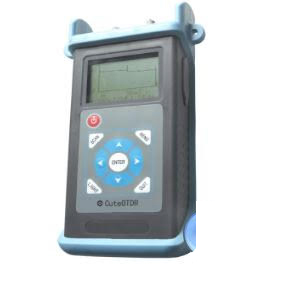
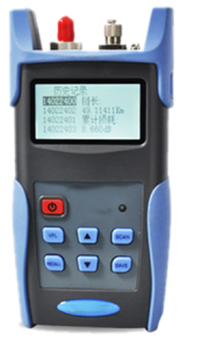
Description
Key Features
- Test smart, accurate, and direct fiber link given event type, location and loss information.
- Simple, fast, without complex training, suitable for field operation.
- Event dead zone less than 5 m and attenuation dead zone less than 10 m.
- USB-based OTDR, data can be uploaded to the PC via USB, graphics loss curve.
- 650 nm visible light output.
- Large data storage, Hand-held design, compact and lightweight.
- Anti-seismic, shockproof protective coat is appropriate to measure in field and on-site.
- 2.5 mm universal connector, FC / ST /SC exchangeable interface.
- Low-power design, suitable for AA-size alkaline batteries.
- Auto shutdown power saving design.
Applications
- Construction and maintenance of telecommunication systems
- CATV construction and maintenance
- Optical components production and research
Technical Specifications
| Wavelength | 1310 nm | 1550 nm | 1310 nm/1550 nm |
| Dynamic Range | 23 dB | 21 dB | 23 dB/21 dB |
| Sensing Fiber | Single mode fibers | ||
| Photo detector | InGaAs | ||
| Measurement Mode | Auto, Manual, and Real time | ||
| Pulse Width | 20 ns, 50 ns, 100 ns, 200 ns, 500 ns, 1000 ns | ||
| Max. Measurement Distance | 37.28 mi (60 km) | ||
| Dead Zone | 5 m (Reflective Event) | ||
| 10 m (Non-reflective Event) | |||
| Loss Measurement Accuracy | 0.1 dB/ dB | ||
| Index of Refraction | Between 1.0 and 2.0. Default setting: 1.4666 | ||
| Scatter Coefficient | Default setting: 52.1 dB | ||
| Non reflection threshold | Default setting: 0.20 dB | ||
| Reflection threshold | Default setting: 60.50 dB | ||
| Min. Measurable Loss | 0.2 dB | ||
| Visible Light Wavelength | 650 nm | ||
| Visual Light Frequency | CW/1 HZ | ||
| General Specifications | |||
| Power Supply | 1.5 V Battery × 3 | ||
| Data storage | 100 Measuring Curves | ||
| Operating Temperature | 32 ℉~+122 ℉ (0 ℃~+50 ℃) | ||
| Storage Temperature | (-4 ℉~+140 ℉) (-20 ℃~+60 ℃) | ||
| Operating Humidity | 0 % ~ 90 % R.H. non-condensing | ||
| Fiber Connector | FC/APC/PC | ||
| Dimensions (L × W × H) | 8.26 in × 4.72 in × 2.12 in (210 mm × 120 mm × 54 mm) | ||
| Weight | 1.10 lbs (500 g) | ||
Ordering Information
| Module No. | Wavelength | Dynamic Range |
| GAO-OTDR-111-A | 1310 nm | 23 dB |
| GAO-OTDR-111-B | 1550 nm | 21 dB |
| GAO-OTDR-111-C | 1310 nm/1550 nm | 23 dB/21 dB |
Packaging List
| No. | Item Description | Quantity |
| 1 | OTDR main engine | 1 |
| 2 | User’s manual | 1 |
| 3 | USB data cable | 1 |
| 4 | Software CD | 1 |
| 5 | 1.5V AA battery | 3 |
| 6 | Power adapter | 1 |
| 7 | BB-002 Clean Cotton Stick | 1 |
| 8 | FC Adapter | 1 |
| 9 | Quality Certificate | 1 |
| 10 | Portable pack | 1 |
Operating Instructions
Power on – Three seconds after pressing the key, the welcome interface will be displayed on the LCD.
Connect Optic Fiber
- Connect optic fiber to OTDR optic output directly, no tools needed. Make sure aim at the location hole.
- Clean connectors carefully.
- Clean tie-ins and check whether they are FC/PC tie-ins or not.
- Connect optic fiber to the instrument
Parameter Setting
If the parameters are unclear, please use the default parameters of the instrument, however, this may cause an increase of measurements errors.
Operating steps:
Press the key 【MENU】, using the direction key to choose the option 【SCANSET】, press the key 【ENTER】.
Manual mode – If the operators have full knowledge of measured optic fiber, they can set accurate parameters, and achieve optimal measurement results.
Change “Range”:
The following parameters need to be set up:
【Scan Mode】:Choose the manual mode;
【Scan Range】:Choose the parameter which is a little longer than the real range;
【IOR Setting】:Set the IOR of optic fiber;
【Pulse Width】: With narrow pulse width, there will be higher resolution and smaller dead zone; however, the dynamic range will be decreased. On the contrary, wide pulse width can bring higher dynamic range and measure comparatively long distance, but resolution and dead zone will be affected. Therefore, users should make choice between dynamic range and dead zone;
【Average Num】:The longer the average time is, the higher SNR is;
【nRef Thresh】:Only events GE the nRef threshold will be listed;
【Ref Thresh】:Only reflection events GE the Ref threshold will be displayed in events list;
【Scatter Co-ef】:Scatter coefficient determines the value of backward scatter power.
Auto mode- Auto measurement can be applied in case that the length of optic fiber is unidentifiable. OTDR auto select adequate range for measurement. In this mode, parameter
【Scan Range】and 【Pulse Width】will be ignored .Besides, users should set up parameter【IOR Setting】and【Scatter Coef】based on the real optic fiber. Others could choose the default setting.
After setting up, press the key【QUIT— choose【SAVE】— 【RETURN】
Measuring
Press the key【SCAN】waiting for the end of measuring progress bar.
View results and save trace.
Definition of Trace: After one measurement, reflection power diagram will be displayed as distance function. This diagram is referred to as trace.
The instrument will show the result on the information window after the end of measuring.
Trace of OTDR shows the results include total length of the optical fiber, number of events, total signal loss of the optical fiber and attenuation coefficient.
The y-axis stands for power, and the x-axis stands for distance.
No. 0/7: 0 is the total trace. There are 7 events in this trace.
Press the key can choose a event.
Press the key 【ENTER】can view magnifying trace.
In the total trace window, press the key【ENTER】can view the event list. Press the key can view every event.
Save the file:
Press the key【QUIT】— choose【SAVE】— using the direction key modify time and name —【ENTER】—【ENTER】—【ENTER】—【RETURN】
Browse saved traces
【MENU】—【HISTORY】— 【ENTER】
This operation can browse saved traces. Choosing a file through direction key【】and 【】—【ENTER】—【Detail】
Upload data to PC
Saved traces can be uploaded to PC through the associated software “OTDRViewer”, with which traces can be further processed on PC.
- Install the software, and run
- Power on OTDR
- Connect OTDR to PC through USB interface cable
- 【MENU】—【HISTORY】— 【ENTER】【】【】—【ENTER】—【Upload】Upload data with the software. The whole process is as in,
Restore default setting
【MENU】—【SYSSET】—【Load Default】—【YES】—【ENTER】—【QUIT】—【SAVE】
Real-time measurement
With the associated software “OTDRViewer”,users can upload data while measuring.
- Install the software, and run
- Connect OTDR to PC through USB interface cable
- Power on OTDR and choose auto or manual mode
- Start measuring
- The software will show the trace after measuring.
Finding fault location by visible light
The instrument can find fault location by visible light. Wave length of the light is 650nm. Frequency of the light is CW/1Hz.
Operating steps:
Press the key 【MENU】— 【SYSSET】— 【VFL Setting】— Changing the
【CW】and【1HZ】 by direction key
You can see the visible light outputting though the VLS interface. Changing to the option
【OFF】, the light will be closed.
Reasons of Measurement Failures
If measurement failures occur, reasons may be one of the following:
- Events may be too close to each other shorten the pulse width, and make another try. If failure still occurs, please try to measure at the other end of the Optic Fiber Low SNR
- Try to use wider pulse or increase average time, and make another try incorrect parameter configuration
- Check parameter configuration, and make another try.


