Description
Overview
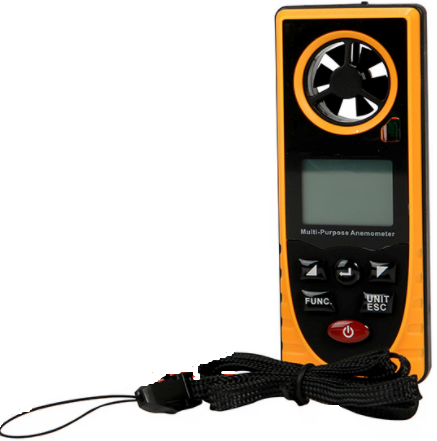
GAOTek Multi-Purpose Anemometer (Temp, Humidity & Dew-Point) is designed to measure the temperature, humidity, wind chill, dew point, wind speed, barometric pressure, altitude and illumination. It has the manually save data saving function and automatically recording data function as its feature. The anemometer also has a unit switching function. It adopts a matrix liquid-crystal display screen with backlight and display the content richer. This anemometer measures quickly with the response time 1 second.
Key Features
- Data save function: manually saving and automatically recording data
- Unit switching function
- Adopting a matrix liquid-crystal display screen so that the display content is richer
- LCD backlighting display
- Battery level display
Technical Specifications
| Temperature | Range : -4 oF to 140 oF (-20 oC ~ 60 oC) |
| Resolution: 32.18 oF (0.1 oC) | |
| Accuracy: ± 1.0 oC | |
| Humidity | Range: 0 ~ 100 % RH |
| Resolution: 0.1 % RH | |
| Accuracy: ± 5 % RH | |
| Wind Chill | Range : -40 oF to 140 oF (-40 oC ~ 60.0 oC) |
| Resolution: 32.18 oF (0.1 oC) | |
| Accuracy : (± 2.0 oC) | |
| Dew Point | Range : -40 oF to 140 oF (-40 oC ~ 60 oC) |
| Resolution : 32.18 oF (0.1 oC) | |
| Accuracy: (± 2.0 oC) | |
| Wind Speed | Range: 0.7 m/s ~ 30 m/s |
| Resolution: 0.1 m/s | |
| Accuracy : ± 3 % or ± 0.3 m/s | |
| Barometric Pressure | Range: 300 hpa ~ 1100 hPa |
| Resolution: 0.1 hPa | |
| Accuracy: ± 1.0 hPa | |
| Altitude | Range : 1640 ft ~ 2952.76 ft (-500 m ~ 9000 m) |
| Resolution: 3.28 ft (1 m ) | |
| Illumination | Range : 0 ~ 55000 Lx |
| Resolution: 1 Lx | |
| Accuracy: ± 3% | |
| Response Time | 1 Second |
| Power Supply | CR2032,3 V (2 pieces) |
| Size | 1.88 in x 0.83 in x 4.80 in (48 mm x 21.2 mm x 122 mm) |
Additional Information

How it works:
This product is a portable multi-functional anemometer and it is suitable for measuring temperature, humidity, wind chill, dew point, wind speed, barometer pressure, altitude and illumination.
Because the measurement of altitude is influenced by barometric pressure and temperature. So altitude values measured in different seasons and different climates are different but in the same condition and day barometric pressure and temperature slightly vary. The altitude reading is stable so it can be used for measuring the altitude difference.
COMPONENT NAMES AND BUTTON FUNCTIONS

- Open this cover when measuring illumination and align to light source
- Fan blade
- LCD display screen
 Button: leftwards/upwards/reduce
 Button: Confirm/enter/start
 Button: rightwards/downwards/increase
 Button: switching the switching items of sensor
 Button: unit switch/exit/backlight switch. On the data display interface of sensor, short press this to switch unit and long press to on the backlight. On the setting interface, short press this to exit and long press to on the backlight.
 Button: Start up or shut down
- Battery door.
MAIN MENU INTERFACE
Press the button to start the anemometer and then enter into main menu interface. After interface logo displayed for 1 second press left or right buttons to select items. Press confirm button to select. Meter enters into desired display interface.

- Temperature
- Humidity
- Wind Chill
- Dew point
- Wind speed
- Barometric pressure
- Altitude
- Illumination
- Settings
- Item name
DATA DISPLAY INTERFACE OF SENSOR
Data display sensor has two models: Character model and Curve model. In the character model the data of three sensors can be displayed at the same time but in the curve model data of only one sensor can be displayed. After entering the data display interface press the confirm button to enter the small shortcut icons interface. After that highlight the desired shortcut icons using left and right button and press confirm button to confirm the selection.
Interface description as follows

- Return Menu
- Display the maximum value, minimum value and average value.
- Setting
- Switching between Character and Curve Model
- Save the data of the current sensor
- View the saved Data
- Delete the saved Data
- Start the function automatically recording data.
- “n” Value
- Battery Level
- Item Name
- Item unit
- Item icon
- Item value
- Item lower-limiting value
- Indication strip
- Item Upper-limiting value
Note: n Value has different meaning in different interfaces
- In the character model, the n value of the data display interface of the single sensor is always 1
- On the data display interface of multiple sensor n value is the location number of the sensor. Long pressing “Switch” button n value can be changed
- In the curve model, on the interface, n value is the location number of the current data in the curve chart.
Interface Description

Interface Description

a.The value of the highest point on the current interface
b.The value of the lowest point on the current interface
c.The current real time value measured.
SETTING THE INTERFACE
Select setting in the main menu or select the small short cut icon on the data display interface of the sensor to and press the “enter” button to confirm to enter into the setting interface. The selectable parameters are as follows
- Menu model
- Item model
- Item number
- Save data
- View data
- Delete data
- Shutdown setting
- Language
- Restore defaults
Menu Model
- Text menu: The main menu interface in numeric character in the data display interface of the sensor
- Graph Menu: The main menu interface is displayed in Graph form
Item Model
- Character Model: The data displayed in numeric character in data display interface of the sensor
- Curve Model: The data displayed in histogram format in data display interface of the sensor
Item Number
When the item model is the character model, item number is the number of the data of the sensors displayed at the same time
Save Data
- Save the data of the current sensor. Maximum 200 groups
- Automatically save
- Time interval: the time interval to save data automatically
- Save Group Number: number of data saving groups. Maximum 400 groups
- Display: During automatic save the displayed is opened or closed. If the display is closed is set the display is automatically closed and displayed after 5 sec.
- Startup of automatically saving: While starting to save the current data automatically old data which was already there will be deleted and then only the current data will be stored. During this function only shutdown and back light functions are active. Others functions are inactive. Only the after completion of automatic saving other functions will be active.
View Data
- Memory Area 1 : The manually saved data is saved in this list in numeric form
- Memory Area 2: The automatically saved data is saved in this list in graphical form
Delete Data
- Memory area 1 : delete the data saved in this list
- Memory area 1: delete the data saved in this list
Shutdown Setting
- Automatic Shutdown: Allowed/prohibited
- Automatic shutdown Time: This informs the meter to shutdown the meter automatically without any manual intervention. If the battery is low the meter anyway shuts down even there is automatic shut down time is set.
Language
English
Restore Defaults: Restore factory default settings
- Confirm: to preset the parameter to factory defaults
- Cancel
VIEW THE DATA INTERFACE
Data interface of Memory Area 1.

This interface is displayed in list form. The contents are (from left to right)
- Serial number
- Name
- Value
- Units
Names of the indicators are as follows
- T- Temperature
- H – Humidity
- WC – Wind Chill
- DP- Dew Point
- WS- Wind Speed
- B-Barometric Speed
- A- Altitude
- I – Illumination
By pressing “Switch” key user can select list number and selection number in turn.
Data Interface of Memory area 2

This interface is displayed in histogram format. The Max/Min/Avg values are on the left upper corner of the display and it saved on the memory area 2. “n” value on right upper corner is the serial number of data point. By pressing the switch button you can select Max, Min or Average value. The data can be viewed by pressing left or right button. The serial number of the data point can be changed by pressing the increase or decrease button. Press Confirm button to save the changes. The indication point below the histogram will move below the corresponding column when the histogram is highlighted.Images can be moved through the left and right buttons. The H value of the last row means the value of the highest point on the current display interface. The L value of last row means the value of the lowest point on the current display interface which is corresponding to the serial number of n value.


