Description
Key Features
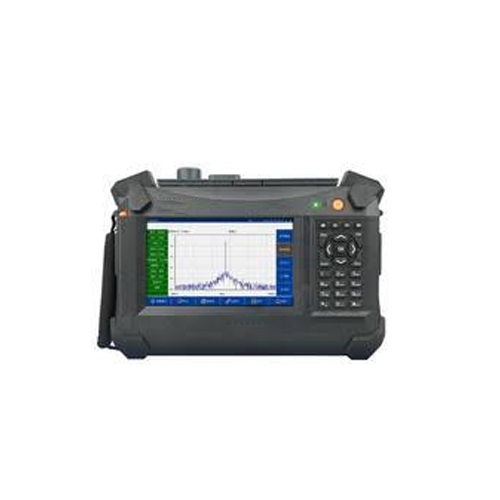
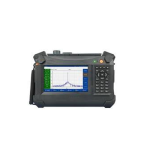
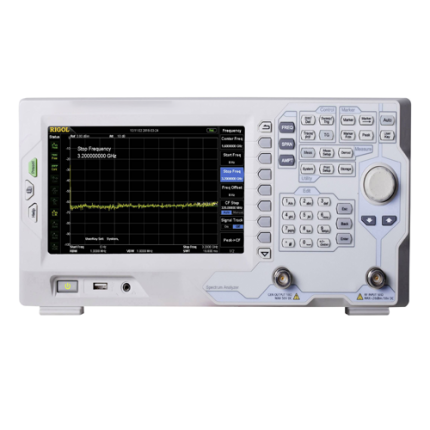
- 5 inches large high-definition screen for clear view
- Sleek and vivid structural design
- User-friendly menu
- Light-weight, compact, easy to carry
- Offers 6600 mAh large-capacity rechargeable battery for continuous working of up to 4 hours
- Suitable for indoor and outdoor use
- PC support for remote control
- USB Interface
- SCPI Support
Technical Specifications
GAOTek Model ID | GAO-SAU-102-GT00Z800ZZ | GAO-SAU-102-GT00Z800ZW | GAO-SAU-102-GT00Z800ZV |
Spectrum Measurement | |||
Range | 9 kHz ~ 2 GHz | 9 kHz ~ 2.6 GHz | 9 kHz ~ 3.6 GHz |
Resolution | 1 Hz | ||
Accuracy | ± (Frequency Marker Readout * Frequency Reference Accuracy + 1 %*Span+10 %*RBW+0.5*[Span/ (Sweep Points-1)] +1 Hz) | ||
Internal Reference (10 MHz) | Aging Rate: < 1 ppm/year
Stability Over Temperature: < 0.5 ppm 59 °F ~ 95 °F (15 °C ~ 35 °C) |
||
Resolution Bandwidth (RBW) | |||
Range | 10 Hz ~ 3 MHz,
Customized down to: 1 Hz ~ 10 Hz |
||
Electability (60 dB/3 dB) | RBW ≤ 500 kHz; < 5:1 Typical (Digital implementation, next to Gaussian shape); 5 % Typical | ||
Accuracy | RBW ≤ 500 kHz; < 5 % Typical | ||
Video Bandwidth | 10 Hz ~ 3 MHz | ||
Average Noise Level (1 Hz RBW, 0 dB RF Attenuator) | |||
Preamplifier Off | 100 kHz ~ 1 MHz: <-100 dBm-3 × (f/100 kHz) dB 1 MHz ~ 10 MHz: <-130 dBm 10 MHz ~ 1 GHz: <-135 dBm 1 GHz ~ 3.6 GHz: <-130 dBm |
||
Preamplifier On | 100 kHz ~ 1 MHz: <-120 dBm-3 × (f/100 kHz) dB 1 MHz ~ 10 MHz: <-150 dBm 10 MHz ~ 1 GHz: <-155 dBm 1 GHz ~ 3.6 GHz: <-148 dBm |
||
Phase Noise (fc = 500 MHz) | |||
Offset 30 kHz | -90 dBc/Hz | ||
Offset 100 kHz | -100 dBc/Hz | ||
Offset 1 MHz | -110 dBc/Hz | ||
Sweep Time | |||
Span (100 Hz≤SPAN≤3.6 GHz) | 10 ms to 3000 s | ||
Zero Span | 1 ms to 3000 s | ||
Sweep Modes | Continuous, Single | ||
Trigger | |||
Trigger Source | AUTO, Video, EXT | ||
Offset 100 kHz | 5 V TTL Level (Typical) | ||
Frequency Counter | |||
Resolution | 1 Hz, 10 Hz, 100 Hz, 1 kHz | ||
Uncertainty | Frequency Readout × Frequency Reference Progress + Counter Resolution | ||
Amplitude Accuracy | 68 °F ~ 86 °F (20 °C ~ 30 °C) | ||
Overall Amplitude Accuracy (90 %) | ±1.5 dB
Input Signal Range: -50 dBm ~ 0 dBm |
||
Amplitude | |||
Max. Safe Input Level | Average Continuous Power: +27 dBm | ||
Max. Input DC Voltage | 50 V dc | ||
Input Attenuator Range | 0 dB ~ 39 dB, in 3 dB step | ||
1dB Compression | +7 dBm | ||
Internal Memory | 128 MB | ||
Residual Response | |||
Third-Order Intercept (TOI) | >30 MHz: +13 dBm | ||
Second Harmonic Intercept (SHI) | +30 dBm | ||
Input Related Spurious | <-60 dBm | ||
Residual Response | <-85 dBm | ||
Tracking Generator (Optional) | |||
Frequency Range | 100 kHz to 1.5 GHz | ||
Output Power | -30 dBm ~ 0 dBm, in 1dB step | ||
Output Flatness | ±3 dB | ||
Input/output | |||
RF Input | N Type, Female (50 Ω) | ||
USB | USB Host, USB Device | ||
LAN | 10/100 Base-T, RJ-45 Connector | ||
AM/FM Demodulation | Headset | ||
Reference Input/output | 10 MHz, BNC Female,
Input: 0 dBm ~ +10 dBm; Output: 0 dBm ±2 dB |
||
General Characteristics | |||
Power | Li-ion Battery: 7.4 V 6600 mAh: DC Adapter: 100 V ~ 240 V AC 50 Hz/60 Hz 1.5 A | ||
Display | 6.5″ TFT LCD, VGA (640 × 480 pixel) | ||
Product Size (W × H × D) | 7.16 in × 11.33 in × 5.59 in (182 mm × 288 mm × 142 mm) | ||
Product Net Weight | 6.61 lbs (3.0 kg) |
Additional Information
GAOTek Handheld Spectrum Analyzer | GAO-SAU-102- GT00Z800ZZ | GAO-SAU-102-GT00Z800ZW | GAO-SAU-102-GT00Z800ZV |
Range | (9 kHz~2 GHz) | (9 kHz~2.6 GHz) | (9 kHz~3.6 GHz) |
Standard Accessories:
User Manual | 1 |
Programming Manual | 1 |
AC/DC Adapter (AC input, +9 V output) | 1 |
Quick Start Guide
Front Panel
Descriptions of Front Panel
No. | Description | No. | Description |
① | LCD display screen | ⑦ | Up, down direction keys |
② | Keys of soft menu | ⑧ | Number keyboard |
③ | Function keys | ⑨ | Tracking source output |
④ | Reset key | ⑩ | Internet access |
⑤ | Power on/offkey | ⑪ | USB interface of equipment |
⑥ | Knob | ⑫ | RF input |
Descriptions of Function Keys on Front Panel
![]() |
Set center, start and stop frequency |
![]() |
Set frequency range to be swept |
![]() |
Set reference level, RF attenuator, pre-amplification, scale, unit and other parameters |
![]() |
Set spectrum analyzer’s resolution bandwidth, video bandwidth, trace average, sweep time and other parameters |
![]() |
Set trace, wave detection mode, max. hold, min. hold and other parameters of swept signal |
![]() |
Full-band auto search positioning signal |
![]() |
Set tracking source, demodulation, trigger, Pass-Fail and other functions |
![]() |
Advanced measurement functions |
![]() |
Set parameters related with system |
![]() |
Read amplitude, frequency, sweep time and etc of points on trace by marker |
![]() |
Peak search function |
Side Panel
Descriptions of Side Panel
No. | Description | No. | Description |
① | External trigger signal input
BNC Interface |
④ | Earphone interface |
② | Reference clock input/output
BNC Interface |
⑤ | Power adapter interface |
③ | USB interface | ⑥ | Battery installing-removing chamber |
AC/DC Power Adapter
INPUT: AC voltage: 100 V-240 V, frequency: 50 Hz/60 Hz, rated current: 1.5 A;
OUTPUT: output DC voltage: +9 V, rated output current: 4000 mA.
Master USB
Spectrum analyzer can be connected with external USB equipment as “master equipment”.
Such interface supports general USB drives, and is able to read and write data and documents.
Battery
GAOTek Spectrum Analyzer adopts rechargeable battery. Battery output voltage range is 7 V-9 V; battery is 6000 mAh large-capacity lithium battery.
Trigger Input
External trigger signal is input to spectrum analyzer’s trigger port through BNC interface, product port is marked as “TRIG IN”.
Reference Clock Input/Output
When set internal reference, output 10 MHz reference clock from this interface; when set external reference, user can input 10 MHz reference clock from this interface for instrument. Product port is marked as “REF IN/OUT”.
Start-up
After connecting with power adapter or installing battery, press Power-On key on the front panel to open spectrum analyzer, and you will know start-up initialization process information by start-up system loading progress indication. After start-up picture, sweep frequency curve appears on the screen.
Press Power-On Key on the front panel to open spectrum analyzer, press “System”
key “System information”, and you can read power supply mode and battery power in “System information”.
User Interface
Description of User Interface
No. | Name | Description |
① | Logarithmic Scale Display | Display data output in logarithmic or linear format |
② | Attenuation Value | Display values of attenuator |
③ | Wave Detection | Display wave detection modes of spectrum curve |
④ | Video Bandwidth | Display values of video bandwidth |
⑤ | Resolution Bandwidth | Display values of resolution bandwidth |
⑥ | Spectrum Curve | Display normal curve after start-up of spectrum analyzer |
⑦ | Sweep time | Display sweep time of sweep frequency |
⑧ | Span | Display value of span in current state |
⑨ | Center frequency | Display values of center frequency |
⑩ | Scale | Display scale values marked |
⑪ | Reference level | Display values of reference level |
⑫ | Battery icon | Display batter power |
Parameter Input
Parameters can be input by number keys, up and down direction keys and knob.
Number Keyboard
Number keyboard are composed of following parts:
- Number keys
0-9 number keys are used to directly input parameter values required. - Decimal point
When inputting parameters, press this key, and a decimal point “.” is inserted at the position where current cursor is. - Symbolic key
Symbolic key “-” is used to change symbols of parameters. - Unit keys
Unit keys include GHz/dBm, MHz/dBm, kHz, Hz, s, and ms. After inputting digitals, press required unit key to finish the input of parameters.
Knob
Functions of knob include:
- When parameters are under editable state, rotate knob to increase (clockwise) or decrease (counter clockwise) values of parameters in specific stepping.
- When editing file names, knob is used to select different characters on the soft keyboard.
- Realize some simple auxiliary functions during measurement.
Basic Measurement
Use continuous-wave signal (output frequency: 300 MHz, amplitude: -10 dBm) generated by a signal of measurement source.
Note:
Amplitude of input signal shall not greater than +30 dBm (1 W) to avoid damage of spectrum analyzer.
Measurement steps are as follows:
Connect equipment
Connect signal output of signal generator with RF INPUT 50 Ω of spectrum analyzer.
Set parameters
Reset instrument
— Press PRESET key, all parameters of instrument are reset to factory defaults.
Set center frequency
— Press FREQ key, frequency menu appears at the bottom of screen, [ Center frequency] soft menu is highlighted, parameters of center frequency appear in the upper left of the screen grid, indicating center frequency function has been activated.
— Values of center frequency can be changed by using number keyboard, knob or direction keys.
— Press number keys to input 300 MHz, and spectrum analyzer’s center frequency is set as 300 MHz.
Set span
Press key, span menu appears at the bottom of screen, [Span] soft menu is highlighted, parameters of span appear in the upper left of the screen grid, indicating span function has been activated.
—Values of span can be changed by using number keyboard, knob or direction keys.
— Press number keys to input 5 MHz, and spectrum analyzer’s span is set as 5 MHz.
Upon completion of above steps, 300 MHz spectrum curve can be observed from spectrum analyzer.
Use marker to measure frequency and amplitude
— Press Marker key [Frequency marker] 1, activate Marker1.
— Press Peak key, marker will make marks at the maximum peak of signal, and then press [Frequency center frequency], in that way, tested spectrum peak point is displayed in the middle of screen, and frequency values and amplitude values of marker are displayed in the upper right of screen grid.
Read measurement results
Input signal (frequency: 300 MHz, amplitude: -10 dBm), results obtained by the measurement of Spectrum Analyzer are shown as below:
View of Measured Signal
Descriptions of Menu
Menu Maps
Function maps of relevant menu keys on the panel of spectrum analyzer in alphabetical order are provided.
- AMP
- BW/SWP
- FREQ
- MARKER
- MEAS
- MODE
- PEAK
- SPAN
- TRACE
AMP
BW/SWP
FREQ
MARKER
MEAS
MODE
PEAK
SPAN
TRACE
Descriptions of Basic Functions
Function key | Access key | Descriptions |
[AMP] | —— | Activate reference level function, soft menu for the setting of amplitude pops up. |
[Referencelevel] | [AMP] | Activate reference level function. |
[Attenuator]
Auto Manual |
[AMP] | Adjust spectrum analyzer’s input attenuator, set in auto or manual mode. |
[Pre-amplification]
On Off |
[AMP] | Set pre-amplifier in on or off mode. |
[Scale/degree] | [AMP] | Select 1, 2, 5 or 10 dB logarithmic amplitude scale. |
[Scale types] Linear
Logarithmic |
[AMP] | Select types of scale displayed in vertical axis as linear or logarithmic scale, default to logarithmic scale. |
[Reference offset] | [AMP] | Add certain offset to all amplitude readings, but position of screen track keeps unchanged. |
[Reference unit▼] | [AMP] | Soft menu for the unit setting of amplitude pops up. |
[dBm] | [Reference unit▼] | Select dB relative to 1 mW as unit of amplitude. |
[dBμW] | [Reference unit▼] | Select dB relative to 1 μW as unit of amplitude. |
[dBpW] | [Reference unit▼] | Select dB relative to 1 pW as unit of amplitude. |
[dBmV] | [Reference unit▼] | Select dB relative to 1 mV as unit of amplitude. |
[dBμV] | [Reference unit▼] | Select dB relative to 1 µV as unit of amplitude. |
[W] | [Reference unit▼] | Select “V” as displayed unit of amplitude. |
[V] | [Reference unit▼] | Select “V” as displayed unit of amplitude. |
[BW/SWP] | —— | Soft menu for the setting of bandwidth and sweep pops up. |
[Resolution bandwidth]
Auto Manual |
[BW/SWP] | Set resolution bandwidth in auto or manual mode. |
[Resolution stepping]
Default Continuous |
[BW/SWP] | Adjust spectrum analyzer’s resolution stepping, resolution defaults to 1-3-5, and 1 step in continuous state. |
[Video bandwidth]
Auto Manual |
[BW/SWP] | Set video bandwidth in auto or manual mode. |
[Trace average]
On Off |
[BW/SWP] | Enable or disable trace average function. When it is on, continuously calculate average of smooth track. |
Descriptions of Basic Functions (continued)
Function key | Access key | Descriptions |
[Sweep time]
Auto Manual |
[BW/SWP] | Adjust spectrum analyzer’s sweep time. Sweep time is in auto or manual mode, matching with resolution bandwidth and span. |
[Swept point] | [BW/SWP] | Set swept point. |
[Single sweep] | [BW/SWP] | Set single sweep mode. |
[Continuous sweep] | [BW/SWP] | Set continuous sweep mode. |
[EMI bandwidth▼] | [BW/SWP] | Soft menu about EMI bandwidth measurement pops up. |
[EMI bandwidth]
On Off |
[EMI bandwidth▼] | Enable or disable EMI bandwidth measurement. |
[EMI bandwidth▼] | [EMI bandwidth▼] | Parameters for the setting of EMI bandwidth measurement pops up. |
[1MHz] | [EMI bandwidth▼] | Set EMI bandwidth as 1 MHz. |
[120KHz] | [EMI bandwidth▼] | Set EMI bandwidth as 120 kHz. |
[30KHz] | [EMI bandwidth▼] | Set EMI bandwidth as 30 kHz. |
[9KHz] | [EMI bandwidth▼] | Set EMI bandwidth as 9 kHz. |
[FREQ] | —— | Activate center frequency (or start frequency), soft menu for the setting of frequency functions pops up. |
[Center frequency] | [FREQ] | Activate center frequency function, set spectrum analyzer in center frequency span mode. |
[Start frequency] | [FREQ] | Activate start frequency, set spectrum analyzer in start-stop mode. |
[Stop frequency] | [FREQ] | Activate stop frequency, set spectrum analyzer in start-stop mode. |
[Frequency stepping]
Auto Manual |
[FREQ] | Adjust stepping of center frequency, so as to make center frequency increase or decrease as set stepping. |
[Frequency offset] | [FREQ] | Get certain offset superimposed to displayed frequency value, including frequency value of frequency marker. But this doesn’t influence sweep range. |
[Frequency reference]
Internal External |
[FREQ] | Set frequency reference mode: internal or external mode. |
[MARKER] | —— | Activate frequency marker, and soft menu related with frequency marker pops up. |
[Frequency marker]
1 2 3 4 5 |
[MARKER] | Set frequency marker as any one or several among marker 1, 2, 3, 4 and 5. |
[Trace]
1 2 3 4 5 |
[MARKER] | Select trace 1, 2, 3, 4 or 5, for easy setting of corresponding trace parameters. |
[Normal] | [MARKER] | Recover marker’s normal function. |
Descriptions of Basic Functions (continued)
Function key | Access key | Descriptions |
[Difference] | [MARKER] | Set frequency marker of any other marker, except for marker 1, as frequency of frequency marker which differs by ∆ from the frequency of marker 1 (set as reference frequency). |
[Off] | [MARKER] | Close frequency marker function menu currently activated. |
[All off] | [MARKER] | Disable all frequency marker functions currently activated, and frequency marker is not displayed any longer. |
[Frequency marker list]
On Off |
[MARKER] | Open or close contents displayed in all frequency marker tables. |
[Frequency marker function▼] | [MARKER] | Activate soft menu related with frequency marker functions. |
[Function off] | [Frequency marker function▼] | Disable frequency marker measurement function. |
[NdB]
On Off |
[Frequency marker function▼] | Enable or disable XdB measurement function, X defaults to 3. |
[Frequency marker noise]
On Off |
[Frequency marker function▼] | Enable or disable frequency marker noise function. When it is on, average noise level read from frequency marker is normalized as noise power with 1Hz bandwidth. |
[Frequency counting▼] | [Frequency marker function▼] | Soft menu of frequency counting function pops up. |
[Frequency counting▼]
On Off |
[Frequency counting▼] | Open or close frequency counter (activate a frequency marker). When such counter is open, display counting results. |
[Resolution bandwidth] | [Frequency counting▼] | Set counting resolution. |
[Frequency marker▼] | [MARKER] | Activate frequency marker, and soft menu related with “Frequency markerĺ” pops up. |
[Frequency marker→center frequency] | [Frequency marker→▼] | Set center frequency equal to frequency of frequency marker. |
[Frequency marker→frequency stepping] | [Frequency marker→▼] | Set center frequency’s stepping equal to frequency of frequency marker; center frequency can be changed by stepping key. |
[Frequency marker→start frequency] | [Frequency marker→▼] | Set start frequency equal to frequency of frequency marker. |
[Frequency marker→stop frequency] | [Frequency marker→▼] | Set stop frequency equal to frequency of frequency marker. |
[Frequency marker→reference level] | [Frequency marker→▼] | Set reference level equal to amplitude of frequency marker. |
[Frequency marker∆→span] | [Frequency marker→▼] | Set frequency span equal to frequency marker difference. |
Descriptions of Basic Functions (continued)
Function key | Access key | Descriptions |
[Frequency marker∆→center frequency] | [Frequency marker▼] | Set center frequency equal to frequency marker difference. |
[MEAS] | —— | Soft menus for the measurement of time spectrum, adjacent channel power, channel power, and occupied bandwidth pop up. |
[Measurement off] | [MEAS] | Disable all measurement functions. |
[Time spectrum]
On Off |
[MEAS] | Open or close time spectrum measurement mode. | |
[Adjacent channel power]
On Off |
[MEAS] | Soft menu for measuring adjacent channel power of transmitter pops up. | |
[Channel power]
On Off |
[MEAS] | Enter soft menu of channel power measurement. | |
[Occupied bandwidth]
On Off |
[MEAS] | Enter soft menu of occupied bandwidth measurement. | |
[Measurement setup▼] | [MEAS] | Measurement setup menu, used for the measurement of adjacent channel power, channel power and occupied bandwidth. | |
[Channel bandwidth] | [Measurement setup▼] | Power displayed by integral, and return back to bandwidth. | |
[Spacing between channels] | [Measurement setup▼] | Spacing between center frequencies of main channel and adjacent channel. | |
[The number of adjacent channel] | [Measurement setup▼] | Set the number of upper adjacent channels and lower adjacent channels for adjacent channel power measurement. |
[Occupied power] | [Measurement setup▼] | Calculate power of occupied bandwidth between two frequency markers. |
[MODE] | —— | Soft menu of other measurement functions |
[Tracking source▼] | [MODE] | Soft menu related with the setting of tracking source pop up. |
[Tracking source]
On Off |
[Tracking source▼] | Enable or disable tracking source measurement function. |
[Output power] | [Tracking source▼] | Used to set output power of tracking source |
[Network measurement▼] | [Tracking source▼] | Soft menu about tracking source network measurement function pops up. |
[Network measurement]
On Off |
[Network measurement▼] | Enable or disable network measurement
function. |
[Output power] | [Network measurement▼] | Set output power of signal source at time of network measurement. |
[Reference level] | [Network measurement▼] | Set reference level of network measurement.
|
[Normalization] | [Network measurement▼] | Network measurement users conduct normalization calibration on the spot. |
[Frequency discrimination test▼] | [MODE] | Soft menu about frequency discrimination test functions pops up. |
Descriptions of Basic Functions (continued)
Function key | Access key | Descriptions |
[Frequency discrimination test]
On Off |
[Frequency discrimination test▼] | Enable or disable frequency discrimination test function. |
[Calibration] | [Frequency discrimination test▼] | Reset initial value of frequency discrimination tester to zero. |
[Amplitude▼] | [Frequency discrimination test▼] | Soft menu for the setting of amplitude pops up |
[Output power] | [Amplitude▼] | Set output power of external signal. |
[Input gain▼] | [Amplitude▼] | Soft menu for the setting of input gain pops up. |
[×1] | [Input gain ▼] | Set output amplifier’s multiple ×1. |
[×2] | [Input gain ▼] | Set output amplifier’s multiple ×2. |
[×4] | [Input gain ▼] | Set output amplifier’s multiple ×4. |
[×0.5] | [Input gain ▼] | Set output amplifier’s multiple ×0.5. |
[×0.25] | [Input gain ▼] | Set output amplifier’s multiple ×0.25. |
[Scale] | [Amplitude▼] | Change every scale, easy for viewing trace. |
[DC offset] | [Amplitude▼] | Set DC component. |
[Demodulation▼] | [MODE] | Soft menu of demodulation function pops up. |
[Audio demodulation ▼] | [Demodulation▼] | Soft menu of audio demodulation test function pops up. |
[Audio demodulation]
On Off |
[Audio demodulation ▼] | Enable or disable audio demodulation. |
[Demodulation modes▼] | [Audio demodulation▼] | Soft menu of demodulation mode pops up.
|
[FMW] | [Demodulation modes▼] | Set demodulation mode as broadband FM demodulation. |
[FM] | [Demodulation modes▼] | Set demodulation mode as FM demodulation. |
[AM] | [Demodulation modes▼] | Set demodulation mode as AM demodulation |
[USB] | [Demodulation modes▼] | Set demodulation mode as upper sideband demodulation. |
[LSB] | [Demodulation modes▼] | Set demodulation mode as lower sideband demodulation. |
[Sound volume] | [Audio demodulation▼] | Set volume of sound output by audio
demodulation. |
[Radio station▼] | [Audio demodulation▼] | Soft menu for quick selection of some radio stations pops up. |
[Digital demodulation▼] | [Demodulation▼] | Soft menu of digital demodulation pops up. |
[AM demodulation▼] | [Digital demodulation ▼] | Soft menu of AM demodulation function pops up. |
[AM On Off] | [AM demodulation ▼] | Enable or disable AM demodulation function. |
[Carrier frequency] | [AM Demodulation ▼] | Used to input carrier frequency of AM signal |
[Demodulation bandwidth]
Auto Manual |
[AM demodulation▼] | Set demodulation bandwidth in auto or manual mode. |
[FM demodulation▼] | [Digital demodulation▼] | Soft menu of FM demodulation function pops up. |
[FM]
On Off |
[FM demodulation▼] | Enable or disable FM demodulation function. |
[Carrier frequency] | [FM demodulation▼] | Used to input carrier frequency of FM signal |
Descriptions of Basic Functions (continued)
Function key | Access key | Descriptions |
[Demodulation bandwidth]
Auto Manual |
[FM Demodulation▼] | Set demodulation bandwidth in auto or manual mode. |
[Trigger▼] | [MODE] | Soft menu for the setting of trigger mode pops up. |
[Auto] | [Trigger▼] | Set trigger mode in auto trigger mode, to make speed of sweep trigger as fast as that spectrum analyzer allows. |
[Vedio] | [Trigger▼] | Set trigger in video trigger mode, when input signal is larger than video trigger level, spectrum analyzer begins to sweep. |
[External▼] | [Trigger▼] | Soft menu of external trigger mode pops up. |
[Rising edge] | [External▼] | Set trigger in external rising-edge mode. |
[Falling edge] | [External▼] | Set trigger in external falling-edge mode. |
[Pass-Fail▼] | [MODE] | Soft menu of Pass-Fail measurement function pops up. |
[Window measurement▼] | [Pass-Fail▼] | Soft menu of window measurement mode pops up. |
[Window measurement]
On Off |
[Window measurement▼] | Enable or disable window measurement function. |
[Amplitude line]
On Off |
[Window measurement▼] | Enable or disable amplitude line |
[Frequency line]
On Off |
[Window measurement▼] | Enable or disable frequency line. |
[Window sweep]
On Off |
[Window measurement▼] | Enable or disable window sweep. |
[Amplitude/frequency▼] | [Window measurement▼] | Positions of control line of amplitude and frequency pops up. |
[Upper limit line] | [Amplitude/frequency▼] | Set position of upper limit line. |
[Lower limit line] | [Amplitude/frequency▼] | Set position of lower limit line. |
[Start frequency] | [Amplitude/frequency▼] | Set position of start frequency line. |
[Stop frequency] | [Amplitude/frequency▼] | Set position of stop frequency line. |
[Region measurement▼] | [Pass-Fail▼] | Soft menu of region measurement function pops up. |
[Region measurement]
On Off |
[Region measurement▼] | Enable or disable region measurement function. |
[Upper limit line]
On Off |
[Region measurement▼] | Enable or disable upper limit line.
|
[Lower limit line]
On Off |
[Region measurement▼] | Enable or disable lower limit line. |
[Edit▼] | [Region measurement▼] | Soft menu for the edit of upper and lower limit lines pops up. |
[Frequency offset] | [Edit▼] | Get certain offset superimposed to displayed frequency value, including frequency value of frequency marker. But this doesn’t influence sweep range. |
[Amplitude offset] | [Edit▼] | Add certain offset to all amplitude readings, but position of screen track keeps unchanged. |
[Edit of upper line▼] | [Edit▼] | Soft menu for the edit of upper line pops up. |
Descriptions of Basic Functions (continued)
Function key | Access key | Descriptions |
[Edit of lower line ▼] | [Edit▼] | Soft menu for the edit of lower line pops up. |
[PEAK] | —— | Move frequency marker at the peak of track, and soft menu related with frequency marker function pops up. |
[Max. value search] | [PEAK] | Move frequency marker at the peak of track. |
[Next peak] | [PEAK] | Move active frequency marker to next highest peak of track related with position of current |
[Left peak] | [PEAK] | Move frequency marker to the peak on the left of current frequency marker. |
[Right peak] | [PEAK] | Move frequency marker to the peak on the right of current frequency marker. |
[Frequency marker→center frequency] | [PEAK] | Set peak frequency marker moving to center frequency. |
[Min.value search] | [PEAK] | Look up min. amplitude value on the trace, and mark it by marker. |
[Peak search]
On Off |
[PEAK] | Enable or disable signal tracking function, frequency marker always tracks max. value of current trace. |
SPAN | —— | Activate frequency span, set spectrum analyzer in center frequency span mode, and soft menu for the setting of span pops up. |
[Span] | [SPAN] | Activate frequency span function, set spectrum analyzer in center frequency span mode. |
[Full span] | [SPAN] | Set spectrum analyzer’s span value as maximum value. |
[Zero span] | [SPAN] | Set span as 0 Hz, this function displays input signal in amplitude-time mode, so it is very helpful to observe modulated signals.
|
[Previous span] | [SPAN] | Set spectrum analyzer’s span value as previous span value. |
SYS | —— | Soft menu about system setting pops up. |
[System information ▼] | [SYS] | Open soft menu of system information and system log. |
[System information] | [System information ▼] | Open relevant parameters concerning system information. |
[System log] | [System information ▼] | Open system log to view system revision records. |
[Local language ▼] | [SYS] | Enter soft menu of language setting. |
[Chinese] | [Local language ▼] | System is displayed in Chinese. |
[English] | [Local language ▼] | System is displayed in English. |
[Date/time▼] | [SYS] | Enter soft menu of date and time setting. |
[Date setting] | [Date/time▼] | Set system date. |
[Time setting] | [Date/time▼] | Set system time. |
[Local network▼]
[IP address] |
[SYS] [Local network▼] |
Open soft menu for the setting of local network parameters.
Set host computer’s IP address. |
[Subnet mask] | [Local network▼] | Set subnet mask parameters. |
[Gateway] | [Local network▼] | Set gateway parameters. |
Descriptions of Basic Functions (continued)
Function key | Access key | Descriptions |
[Reset network] | [Local network▼] | Reset network, and re-connect with system. |
[Start-up/Reset▼] | [SYS] | Open soft menu for the setting of start-up and reset. |
[Start-up parameters▼] | [Start-up/Reset▼] | Open soft menu for the setting of parameters concerning start-up. |
[Factory] | [Start-up parameters▼] | Set factory start-up parameters. |
[User] | [Start-up parameters▼] | Set user start-up parameters. |
[Power-off] | [Start-up parameters▼] | When set start-up parameters, call status setting when it is power-off last time. |
[Reset parameters▼] | [Start-up/Reset▼] | Open soft menu for the setting of reset parameters. |
[Factory] | [Reset parameters▼] | Set factory reset parameters. |
[User] | [Reset | Set user reset parameters. |
[Power-off] | [Reset parameters▼] | When set reset parameters, call status setting when it is power-off last time. |
[File▼] | [SYS] | Soft menu related with file pops up. |
[Directory▼] | [File▼] | Used to view storage files. |
[Front page] | [Directory▼] | Set current interface displayed as front page of directory. |
[Previous page] | [Directory▼] | Display previous page of current interface. |
[Next page] | [Directory▼] | Display next page of current interface. |
[End page] | [Directory▼] | Set current interface displayed as end page of directory. |
[File types▼] | [File▼] | Open soft menu of file types, easy for optional view. |
Descriptions of Basic Functions (continued)
Function key | Access key | Descriptions |
[Screen picture] | [File types▼] | Only files in screen picture format can be viewed. |
[Trace data] | [File types▼] | Only files in trace data format can be viewed. |
[All] | [File types▼] | Files in all formats can be viewed. |
[File operation▼] | [File▼] | Soft menu for the operation of storage files pops up. |
[Sort▼] | [File operation▼] | Soft menu for the sorting of storage files pops up. |
[By name] | [Sort▼] | Sort files by names. |
[By time] | [Sort▼] | Sort files by time. |
By size | [Sort▼] | Sort files by file size. |
[Delete▼] | [File operation▼] | Soft menu for the deletion of storage files pops up. |
[Delete selection] | [Delete▼] | Only filed already selected can be deleted. |
[Delete this page] | [Delete▼] | Only files in current page can be selected. |
[Delete all] | [Delete▼] | Delete all storage files. |
[Export▼] | [File operation▼] | Export files. |
[Select] | [Export▼] | Only files already selected can be exported. |
[This page] | [Export▼] | Only files in current page can be exported. |
[All] | [Export▼] | Export all storage files. |
[Import] | [File operation▼] | Get selected files displayed in the interface of spectrum analyzer. |
[Save▼] | [SYS] | Soft menu related with the saving of information in current interface pops up. |
Descriptions of Basic Functions (continued)
Function key | Access key | Descriptions |
[Screen capture▼] | [Save▼] | Information in current interface is saved in the form of screen capture, and related soft menu pops up. |
[Save to local] | [Screen capture▼] | Information in current interface is saved to local storage in the form of screen capture. |
[Save to flash drive] | [Screen capture▼] | Information in current interface is saved to flash drive in the form of screen capture. |
[Trace data▼] | [Save▼] | Information in current interface is saved in the form of trace data, and related soft menu pops up. |
[Save to local] | [Trace data▼] | Information in current interface is saved to local storage in the form of trace data. |
[Save to flash drive] | [Trace data▼] | Information in current interface is saved to flash drive in the form of trace data. |
[User state] | [Save▼] | Set current interface as user state, directly call it when set start-up reset parameters. |
[Print▼] | [SYS] | Soft menu about printing pops up. |
[Paper size▼] | [Print▼] | Soft menu for the size setting of printing paper pops up. |
[A4] | [Paper size▼] | Set printout by A4 paper. |
[A3] | [Paper size▼] | Set printout by A3 paper. |
[B5] | [Paper size▼] | Set printout by B5 paper. |
[C5] | [Paper size▼] | Set printout by C5 paper. |
[Letter] | [Paper size▼] | Set printout by letter. |
[Direction] Lateral
Longitudinal |
[Print▼] | Set print direction, default to lateral. |
[Copies] | [Print▼] | Set copies printed. |
[Print curve] | [Print▼] | Only graphs are printed. |
[Print screen] | [Print▼] | All information on the screen is printed. |
[Display▼] | [SYS] | Soft menu concerning display pops up. |
[Full screen] | [Display▼] | Make pictures displayed in full screen. |
[Window zoom] On Off | [Display▼] | Select display line to change its display position. |
[Display line]
On Off |
[Display▼] | When this menu is open, activate an adjustable horizontal reference line on the screen. |
[Amplitude ruler]
On Off |
[Display▼] | Open or close amplitude ruler, default to on-state. |
[Display style▼] | [Display▼] | Soft menu of display style pops up. |
[Default] | [Display style▼] | Display by default. |
[WinXP] | [Display style▼] | Display by WinXP |
[Backlight adjustment] | [SYS] | Set backlight brightness of LCD screen. |
[User calibration▼] | [SYS] | Soft menu of user calibration pops up. |
[Start to calibrate] | [User calibration▼] | Input external standard signal, user calibration is performed by pressing this key. |
[Reset to factory default] | [User calibration▼] | By pressing this key, user self-calibration data can be deleted, and reset to factory default. |
Descriptions of Basic Functions (continued)
Function key | Access key | Descriptions |
[System service▼] | [SYS] | Enter factory debugging interface by pressing this key. |
[TRACE] | —— | Soft menu related with track and wave detection pops up. |
[Trace]
1 2 3 4 5 |
[TRACE] | Select track register which is operable at present. |
[Refresh] | [TRACE] | Refresh current curve. |
[Max. hold] | [TRACE] | In track register, display and hold input signal’s max. response. |
[Min. hold] | [TRACE] | In track register, display and hold input signal’s min. response. |
[Blanking] | [TRACE] | Clear contents stored in track register from display area. |
[View] | [TRACE] | Display contents stored in current track register, no refresh. |
[Trace operation▼] | [TRACE] | Soft menu for arithmetical operation related with trace pops up. |
[1 ← → 2] | [Trace operation▼] | Get contents in track register 1 and track register 2 exchanged, and then set track 1 and track 2 in display mode at the same time. |
[2-DL→ 2] | [Trace operation▼] | Subtract value of display line from track register 2, and then put the result back to track register 2. |
[2← → 3] | [Trace operation▼] | Get contents in track register 2 and track register 3 exchanged, and then set track 2 and track 3 in display mode at the same time. |
[1→ 3] | [Trace operation▼] | Get contents in track register 1 transferred to track register 3, and then set track 3 in display mode. |
[2→ 3] | [Trace operation▼] | Get contents in track register 2 transferred to track register 3, and then set track 3 in display mode. |
[Wave detection mode▼] | [TRACE] | Soft menu for the setting of wave detection mode pops up. |
[Auto] | [Wave detection mode▼] | Set wave detection mode as auto mode. |
[Normal] | [Wave detection mode▼] | When noise is detected, this wave detection mode alternately displays positive peak andnegative peak. Otherwise, only positive peak is displayed. |
[Positive peak] | [Wave detection mode▼] | As for video signal, select positive peak wave detection mode. |
[Negative peak] | [Wave detection mode▼] | As for video signal, select negative peak wave detection mode. |
[Sampling] | [Wave detection mode▼] | Sample video signal, sample wave detection mode. |
Descriptions of Menu
FREQ
Set spectrum analyzer’s various frequency parameters. Spectrum analyzer sweeps frequency within set frequency range. Once frequency parameters have been changed, it begins to sweep again.
Spectrum analyzer has two types of channel frequency range at present: start frequency/stop frequency, center frequency/span. If any one of them is adjusted, the other three parameters are adjusted accordingly, so as to satisfy coupling relationship among them.
SPAN
Activate span function, and set spectrum analyzer in span mode at the same time. [Span], [Full span], [Zero span] and [Previous span] pop up at the same time by pressing SPAN key. Span can be set by number keys or stepping key. Span can be set as 0 by number keys or [ Zero span].
AMP
Set parameters related with amplitude of spectrum analyzer. By adjusting these parameters, measured signal can be displayed in current window in a certain manner which is easy for observation and is able to minimize measurement errors.
BW/SWP
Set spectrum analyzer’s resolution bandwidth, video bandwidth, sweep time, mode and other related parameters.
AUTO
Automatically search signal within full band, and adjust frequency and amplitude to optimal to realize signal search and auto parameter setting by one key.
TRACE
Sweep frequency signal is displayed by trace on the screen. Related parameters of trace can be set by this menu. 5 trace at most can be displayed at the same time. Soft menu related with trace pops up by pressing this key.
MEAS
Provide various advanced measurement functions, including time spectrum, adjacent channel power, channel bandwidth, and occupied bandwidth.
MODE
Provide other measurement functions, including tracking source, signal source, frequency discrimination properties, demodulation, trigger, and Pass-Fail.
MARKER
Frequency marker is a diamond marker, used to mark points on trace. Amplitude, frequency or sweep time point of points on trace can be read out by marker.
PEAK
Open setup menu of peak search, and perform peak search function.
SYS
Operations related with system: system information, language, date and time, network, start-up/reset, file, save, print, display, backlight adjustment, user calibration and system service.
Measurement Application
The spectrum analyser can perform following functions:
- Measurement of continuous-wave signal
- Measurement of signals with close resolution bandwidth and resolution range
- Measurement of signal frequency by frequency counter
- Measurement of N dB bandwidth
- Measurement of adjacent channel power
- Measurement of channel power
- Measurement of occupied bandwidth
- Measurement of small signal by pre-amplifier
- Measurement of harmonic distortion
- Measurement of Third-order Intercept Distortion
- Measurement of AM modulation signal
Remote Control
Users can program and control spectrum analyzer by standard SCPI (Standard Commands for Programmable Instruments) Command.This spectrum analyzer communicates with PC through instrument bus, such as USB, LAN.
By USB
- Connect equipment
Connect spectrum analyzer with your PC through USB remote control. - Install USB driver
After correct connection between spectrum analyzer and PC and start-up (spectrum analyzer automatically configures USB interface), dialog box of hardware update wizard pops up in the computer. Please install “USB DEVICE” driver according to wizard. - Check equipment resource
Searched resource and USB interface information will appear in “NI-VISA USB Devices” directory, as shown in the following:
- Communication test
Open USB control terminal of upper computer SARemote-Control by double-clicking. By “View–> SCPI instruction”, open remote command control panel, and then you can send command and read data through this panel, as shown in the following:
By LAN
- Connect equipment
Connect spectrum analyzer to your LAN through LAN interface. - Communication test
Open LAN control terminal of upper computer SARemote-Control by double-clicking. Open remote command control panel, and then you can send command and read data through this panel, as shown in the following:
First-time Power-on of the Spectrum Analyzer
The Handheld Spectrum Analyzer is supplied by power adapter or internal battery. When battery is fully charged, internal battery can supply power for about 4 hours if spectrum analyzer works normally. Battery of this device can’t store power during transportation, so, such battery must be charged before first-time use. Battery can be charged while power adapter provided along with equipment supplies power to instrument.
Battery not only can be charged when instrument is power on, but also when it is power off. Time for charging is about 4 hours when instrument is power on or off.
Troubleshooting
Black screen and without any display after start-up
1)Check whether fan works normally:
- If fan works normally, connection wire of display screen may be loose;
- If fan doesn’t work normally, instrument is not normally started. At this time, please handle according to step (2), (3), or (4).
2)If battery supplies power: confirm whether battery is in good condition and has been correctly installed.
3)If adapter supplies power: confirm whether model of adapter is right and such adapter works normally.
4)If power adapter works normally, fuse inside instrument may be burnt out. Please contact with manufacturer for repairing.
No response or error of key value by pressing keys
In case of error of key value, keyboard may be broken. Please contact with manufacturer for repairing.
No signal displayed after normal start-up
Steps: set frequency and power of signal generator respectively as 30 MHz, -20 dBm, connect this signal with RF input; or connect spectrum analyzer’s 10 MHz reference with RF input; if there is still no signal displayed, equipment hardware failure may occur. Please contact with manufacturer.
Signal frequency inaccurately displayed
When test signals, if signal frequency read out is beyond allowable error limit, or signals shakes on the screen:
- Check whether input signal is stable. If yes, please check according to step (2);
- Check internal and external references of spectrum analyzer is normal. Select reference as internal or external reference depending on different tests: press Frequency [Frequency reference Internal External], if frequency read out is still inaccurate, lock-loss may occur to internal circuit of spectrum analyzer.
Signal amplitude inaccurately displayed
If displayed signal amplitude is inaccurate, please check according to following steps:
- Check whether signal amplitude input is right. If yes, please check according to step (2) or (3);
- Re-calibration: set frequency and power of signal generator respectively as 440MHz, -20dBm. Connect this signal to spectrum analyzer’s RF input, and click System [Next page] [Next page] [User calibration] [Start calibration] in turn.
- If signal amplitude displayed is still inaccurate after re-calibration, hardware failures of spectrum analyzer may occur.
Maintenance and Cleaning
Please don’t place instrument in the sunlight for a long time.In case it is unused for a long time, please place instrument in a dry and cool place.Please keep instrument away from any corrosive liquid, to avoid damage of instrument.
Please clean instrument depending on actual service condition. Method is as follows:
- Disconnect power, and close instrument.
- Use wet (not dripping) soft cloth (gentle detergent or clean water can be used) to wipe off dust outside instrument. When clean LCD display screen, please don’t scratch transparent LCD protection screen.