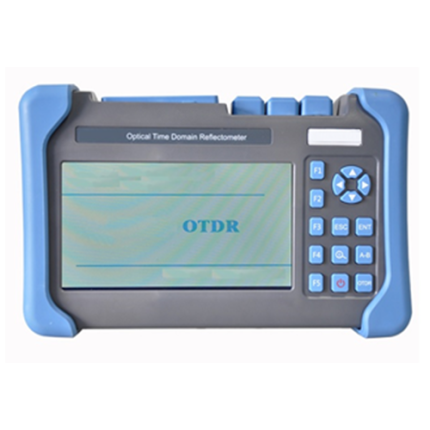
GAOTek OTDR 102, Wide Dynamic Range

This OTDR offers a Wide Dynamic Range (Short Event Dead Zone) and is a high-performance, multifunctional test instrument with many features.

  • This product is currently out of stock and unavailable.

Description

Overview

GAOTek OTDR with Wide Dynamic Range (Short Event Dead Zone) is a high-performance, multifunctional test instrument that measures physical characteristics such as length, transmission loss, splice loss, etc. of optical fibers and cables in a wide dynamic range. It also can exactly locate the faults or breaks in fiber circuits. This instrument has an extra-short event dead zone, which is suitable for testing short optical fiber and pigtail optical fiber. It has 4 optical ports to realize the optical power meter, VFL and single-mode & multimode testing functions. It can be used for testing FTTx network and can also be applied in the field of manufacturing, construction and maintenance of optical fiber communication system.


Key Features

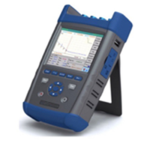
  • Handheld, lightweight and convenience for carrying
  • Advanced antireflection LCD, visible display interface even outdoor
  • duplex operation mode of touchscreen and key-press
  • 8 m extra-short event dead zone, easy to test optical fiber jumper
  • 45 dB high dynamic range, 256 k data sampling points
  • Communication light auto monitoring function
  • Remote function via Ethernet
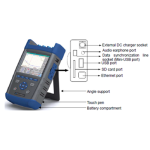
  • Double USB ports for connection of external USB disk & printer and communication with PC via Sync Active software
  • WinCE windows operating system, an operating interface with many languages;
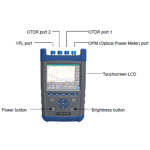
  • Built-in optional visual fault locator (VFL), optical power meter, optical source, audio detection, etc. functions
  • Universal FC/PC,FC/SC,FC/ST connector type, it is convenient for surface cleaning
  • The optical output connector of the device can be replaced randomly which makes cleaning of optical fiber end face convenient
  • Large capacity lithium battery allows the instrument to work for more than 8 hours
  • Unique function of updating application software on-line

Technical Specifications

Optical Output Port Connector FC-PC (Standard)
Screen 640 in × 480 6.4 in color LCD (Touch-screen)
Range Single mode: 0.24 mi, 0.49 mi, 0.99 mi, 1.98 mi, 4.97 mi, 9.94 mi, 19.89 mi, 39.76 mi, 79.53 mi, 34.79 mi, 318.142 mi (0.4 km, 0.8 km, 1.6 km, 3.2 km, 8 km, 16 km, 32 km, 64 km, 128 km, 256 km, 512 km

Multi-mode: 0.24 mi, 0.49 mi, 0.99 mi, 1.98 mi, 3.97 mi, 9.94 mi, 19.89 mi (0.4 km, 0.8 km, 1.6 km, 3.2 km, 6.4 km, 16 km, 32 km (850 nm)

Pulse Width Single mode: 5 ns, 10 ns, 30 ns, 80 ns, 160 ns, 320 ns, 640 ns, 1,280 ns, 2,560 ns, 10,240 ns, 20,480 ns

Multi-mode: 5 ns, 10 ns, 30 ns, 80 ns, 160 ns, 320 ns, 640 ns, 1,280 ns (850 nm)

Refractive Index of Optical Fiber Group Regulate within range of 1.00000 ~ 2.00000
Fiber Cable’s Coefficient of Correction Regulate within range of 0.80000 ~ 1.00000
Range Accuracy ± (0.75 m + sample interval + distance × 2.5 × 10⁻⁵) (Ignore error of refractive index)
Loss Testing Accuracy ±0.02 dB/km (single mode); ±0.2 dB/km (multiple mode);
Distance Display Resolution 6.21 mi (0.0001 km)
Loss Threshold 0.001 dB
Minimum Event Dead Zone ≤1 m (single mode); ≤2 m (single mode)
Maximum Range Resolution 3.10 mi (0.05 m)
Waveform Memory Capacity ≥800 Pieces (detail value varies with the memory capacity of the device)
Port USB port, mini-USB port, SD card port
VFL 650 nm±10 nm, 2 mW (typical); CW/1 Hz
Optical Power Meter Wavelength range: 1270 nm-1700 nm

Measurement range: -60 dBm-3 dBm

Measurement accuracy: 5 % ( -10 dBm, CW)

Power Supply AC/DC adapter: voltage allowable range: 100 V~240 V (1.5 A), frequency allowable range: 50 Hz/60 Hz

DC: 19 V±10% (2 A)

Lithium battery inside: 14.8 V, battery working time: 8 hours (normal temperature, low lightness, not sampling)

Operating Temperature 32 °F~122 °F (0 °C~50 °C)

(Battery Charging: 41 °F~104 °F (5 °C~40 °C))

Storage Temperature 104 °F~158 °F (40 °C~70 °C)

(Battery: -4 °F~140 °F (-20 °C~60 °C))

Relative Humidity 5 % – 95 % RH, non-condensation
Size 11.61 in × 7.32 in × 2.95 in (295 mm × 186 mm × 75 mm)
Weight About 5.95 lbs (2.7 kg)

Additional Information

Main Functions

  • Test the length of optical fiber or fiber cable.
  • Test the distance between two random points on fiber trace.
  • Test and display the loss and the attenuation constant of optical fiber between two random points on trace.
  • Test and display the splice loss of the splice points on trace.
  • Test reflection loss.
  • Splice point automatic scanning function.
  • Test waveform storage: may store the test waveform and test conditions in equipment memory or external USB disk/SD card.
  • File copying function: May copy data files stored in equipment memory directly to USB disk / SD card.
  • Battery indication function of smart battery.
  • Real-time test function, which is convenient for observing the effect of real-time butt joint of fiber.

Typical Application

GAO-OTDR-102 is mainly used to measure FTTx network, it provides multifunctions in one unit.

Description of Instrument Panel

Front Panel of Instrument

Right flank of instrument

Back Panel of Instrument

Right flank of instrument

Back Panel of Instrument

Description of Panel Keyboard and Active Display

Schematic of OTDR Panel Keys

: Press this key, a magnifier icon appears on the trace display area of the main screen as shown in the figure below, then, the trace enters zooming state so the trace can be zoomed in and out around active cursor. Then, press the keyin navigation keys to zoom out and in race horizontally; press the keyin navigation keys to zoom in and out trace vertically.

Press this key again, the magnifier icon disappears, then, trace exits from zooming state and the keyin navigation keys will move cursor left and right horizontally, and the keyin navigation keys will move cursor up and down vertically.

Note:

  1. Zooming trace in can display the local details of test trace.
  2. Pressing the area of entirely display trace in the screen will recover trace to the initial entire display state.

: Press this key to directly enter file saving window.

: Press this key to directly enter system information window.

: Press this key in the operating interface of OTDR module to directly enter the setup window of OTDR test condition; press this key in operation of optical power meter module to directly enter power meter setup sub-menu.

: Press this key to move active cursor to menu bar, and meanwhile it selects the first menu button in the current menu bar by default, then, the selected menu item shows a red small button. Press the keyin navigation keys to select the previous or next menu item and press the key to execute the current selected menu item. Press to make active cursor exit from menu bar and return to the trace display area of screen or operation sub-menu.

: Start key When the operating interface of OTDR module shows main screen, press this key to start OTDR module to test the optical fiber under test and display trace in the operating window.

Note:

  1. The test modes of OTDR include: auto test, real-time test, average test and dead zone test.
  2. The test modes can be set in OTDR parameter setup window.

: Return key This key has three functions: stop test, return to previous menu, abandon current operation and return.

  • When OTDR module is in real-time test or average test state, press this key, OTDR will stop test.
  • When OTDR is in non-test state and operating interface is main screen, press this key, the menu in the menu button display will return to the previous menu bar.
  • When OTDR operating interface is operating sub-window, pressing this key indicates abandoning the current operation and returning to main screen.

:

  • In the main screen, the two keys are used to move current active cursor left and right by default.
  • In the main screen, the two keys are used to zoom in or out current trace horizontally in zooming state.
  • In sub-window, the two keys are used to move active cursor to select different operation item backwards and forwards
  • In character input sub-window, the two keys are used to move left and right to select small button one by one.

:

  • In the main screen, the two keys are used to move current active cursor up and down by default.
  • In the main screen, the two keys are used to zoom in or out current trace vertically in zooming state.
  • In sub-window, the two keys are used to modify the contents of operation item selected by current active cursor.
  • In character input sub-window, the two keys are used to move left and right to select small button quickly.

:

  • In main screen, it is used to switch active cursor.
  • In character input window, key is used to input the character of currently selected small button to the place of quadrate cursor in edit window.
  • In file transfer sub-window, key is used to mark the file selected by the cursor bar in current active window (source disk).
  • Besides above, key is used to confirm current operation and return to main Screen.

Note:

  1. The current active cursor is red and inactive cursor is black.
  2. In file transfer sub-window, only the file with mark * can respond to copying, deleting, etc. operations.

: Power key

When the instrument is off, press this key for about 4 seconds to start the instrument and enter OTDR operating interface to show main screen after system start-up. When the instrument is on, press this key for about 4 seconds to stop the instrument. In ON state, if external power supply is used, this key is red, if internal battery is used and battery is fully charged, this key is green or blue.

: Brightness adjustment key

Press this key to adjust LCD brightness circularly. When VFL is on, this key is continuous red or blinking red in consistent with VFL working mode.

Main Screen

GAO-OTDR-102 can have the optional functions of optical power meter, optical source, visible fault locator (VFL) and audio detection, etc. as required. When function modules

return to the main screen, the screen for function module selection will appear as shown below:

Main screen

  • Touchscreen Operation: Press any one of the five buttons, i.e. OTDR, OPM, Optical Source, VFL or Audio Detection in the screen to enter the operating interface of corresponding module so as to achieve its corresponding function. Press the drop-down button of default module to eject a selection box as shown at the left of the above figure, press the item required, so that the operating interface of the selected module can be entered directly after power on next time.
  • Default Module: After selection, the selected module interface will be entered after power on next time.
  • Key Operation: Press to select any one of the five buttons in the screen, and then pressto enter corresponding module operating interface. Useto move active cursor to the drop-downs of default module and then useto select a module as default one for next power on, after selection, the operating interface of the selected module can be entered directly for next power on.
  • Directly press the drop-down box of default module on the touchscreen to select one.
  • Language Selection: Select the language of interface. Operate the touchscreen and keys as above.
  • System Date: Change system date and pressto confirm the change.
  • Press the time item to be changed in the touchscreen, a small button will appear below the item, and then press the up and down button via touchscreen to change the selected time item.
  • Useto select the time item to be changed and then a small button will appear below the item; pressto change the selected time item.
  • After change, press【Enter】orto confirm the change.

Optical Power Meter Module

If your instrument has the function of optical power meter, please press the button【Optical Power Meter】to enter the operating interface of optical power meter as shown below:

Trace of measured power value

The functions and operations of all menu buttons are described as follows:

  • Start: Start or stop power meter test with the following three methods.
  • Press this button to start the power meter module for test, meanwhile, the button turns to 【Stop】, press this button again to stop power meter test, then, this button turns to【Start】.
  • Pressing the keyon the keyboard can realize the above function.
  • Press the keyon the keyboard to move active cursor to menu bar as shown in the figure below, and then menu item will show a small button.

Then, pressingwill start or stop power meter test function.

  • Wave: Change the test wavelength of power meter.
  • Press this button to change the test wavelength of power meter.
  • Press the key on the keyboard to move active cursor to menu bar, and then menu item will show a small button. Useto move the small button to this menu item and then press to confirm wavelength change.
  • Setup: Enter setup sub-menu as shown in the figure below. Press the menu button via touchscreen or use the keyboard to realize the function of each button with the same method as above. Setup sub-menu is also available by pressing the key on the keyboard.

  • Range: Press this menu button to eject a drop-down box for range selection. Select the range by pressing touchscreen or

Selecting <Auto> indicates the instrument will judge test range automatically.

Select an appropriate range for test; if other fixed range is selected, the instrument will lock the range in test.

  • Times: Press this menu button to eject the drop-down box for times selection, and select times by pressing touchscreen or.
  • Reference: Set the current measured value as reference value.
  • dBm/W: Set the current test mode as dBm test or mw test.
  • Interval: Set the interval of saving measured values. Selecting <Null> indicates there is no interval for saving values; otherwise, a measured value will be saved at the intervals selected.
  • Memory/SD: Set storage path as memory or SD card.
  • Return: Return to previous menu.
  • / Rel.: Set the current data realization mode as relative or absolute mode.
  • Zero: Reset the power meter to zero.
  • Save】:Used to save the test data of power meter. This menu item is only available in test state. In the test state of power meter, press this button (or use keyboard to select this item and then press to confirm) to save the data obtained in current test to file according to the set interval and save path.
  • Return: Exit from the operating interface of power meter to return to the main screen.

Optical Source Module

If your instrument has the function of optical source, please press the button【 Optical Source】 as shown in Figure below to enter the operating interface of optical source as shown in figure below:

Operating interface of optical source

The functions and operations of all menu buttons are described as follows:

  • 【Start】: Start or stop optical source test with the following three methods.
  • Press this button to start the optical source module for test, meanwhile, the button turns to 【Stop】, press this button again to stop optical source test, then, this button turns to

【Start】.

  • Pressing the key on the keyboard can realize the above function.
  • Press the keyon the keyboard to move active cursor to menu bar as shown in the figure below, and then menu item will show a small button. Then, pressingwill start or stop optical source test function.
  • 【Wave】: Change the test wavelength of optical source.
  • Press this button to change the test wavelength of optical source.
  • Press thekey on the keyboard to move active cursor to menu bar, and then menu item will show a small button. Pressto move the small button to this menu item, then, pressto confirm wavelength change.
  • 【Mode】: Change the working mode of optical source. The working mode of optical source is CW, 270Hz, 1kHz and 2kHz
  • Pressing this button will change the working mode of optical source.

Press thekey on the keyboard to move active cursor to menu bar, and then menu item will show a small button. Pressto move the small button to this menu item, then, pressto confirm the change of working mode.

  • 【Return】: Exit from the operating interface of optical source function to return to the main screen.

Visible Fault Locator Module

If your instrument has the function of VFL, please press the button【VFL】to enter the operating interface of VFL as shown in figure below:

Operating Interface Schematic of VFL Module

The functions and operations of all menu buttons are described as follows:

  • 【Start】: Start or stop optical source test with the following three methods.
  • Press this button to start the optical source module for test, meanwhile, the button turns to 【Stop】, press this button again to stop optical source test, then, this button turns to

【Start】.

  • Pressing the key on the keyboard can realize the above function.
  • Press the keyon the keyboard to move active cursor to menu bar as shown in the figure below, and then menu item will show a small button. Then, pressingwill start or stop optical source test function.
  • 【Mode】: Change the working mode of optical source. The working mode of optical source is CW, 270Hz, 1kHz and 2kHz
  • Pressing this button will change the working mode of optical source.

Press thekey on the keyboard to move active cursor to menu bar, and then menu item will show a small button. Pressto move the small button to this menu item, then, pressto confirm the change of working mode.

  • 【Return】: Exit from the operating interface of optical source function to return to the main screen.

Audio Detection Module

If your instrument has the function of audio detection, please press the button 【Audio Detection】to enter the operating interface of Audio Detection Module as shown below.

Operating Interface Schematic of Audio Detection Module

The functions and operations of all menu buttons are described as follows:

  • 【Start】: Start or stop optical source test with the following three methods.
  • Press this button to start the optical source module for test, meanwhile, the button turns to 【Stop】, press this button again to stop optical source test, then, this button turns to

【Start】.

  • Pressing the key on the keyboard can realize the above function.
  • Press the keyon the keyboard to move active cursor to menu bar as shown in the figure below, and then menu item will show a small button. Then, pressingwill start or stop optical source test function.
  • Volume Control: Press the keyon the keyboard to increase volume; press the keyon the keyboard to reduce volume.
  • 【Return】: Exit from the operating interface of optical source function to return to the main screen.

Optical Time Domain Reflectometer

(OTDR)-Operating Instruction

Press the button 【OTDR】as shown in to enter the operating interface of OTDR as shown in the figure.

The operating interface of OTDR is composed of main screen and operating sub-window. After the instrument enters the operating interface of OTDR module, the display will show the main screen of OTDR as shown below:

The menu bar in the main screen shows menu items. Press different menu buttons to enter corresponding sub-menus or finish corresponding functions.

Description of Main Screen

The schematic of main screen is shown below:

(1). Current system clock

(2). Display of test results. The contents of displaying correspond to test items. Test results are calculated according to the position of current cursor.

(3). Entirely display trace. It always displays the entire waveform of trace.

(4). Reference point

(5). Current active cursor Active cursor is red, which can be moved byor pressing touchscreen. The other cursors are black. Active cursor can be set circularly by among the cursors on the screen.

(6). The distance between active cursor and reference point

(7). Display of current average times. No average times are displayed in real-time test mode.

(8). Menu bar. In the main interface, the menu bar displays menu items.

(9). Display of test conditions. It displays the current test range, wavelength, pulse width, test mode, etc. test conditions.

(10). Name and storage date of current file. If the current trace is that saved in the current file, it will display the name and storage date of current file.

(11). Origin distance position. The distance between the current set reference origin and the test port of OTDR *1

(12). Indicator of connection of external adapter. It indicates external adapter has been connected and the instrument is using external power supply to work.

(13). Indicator of current battery capacity. It indicates the current remaining battery capacity.

(14). Indicator of current test trace color. It indicates the line color of trace of current serial number. *2

(15). Vertical scale (dB/)

(16). Horizontal scale (m/ or km/ or ft/ or kft/)

(17). Icon of indicating current active test trace: Blue color indicates the current active trace is Trace 1; dark green color indicates the current active trace is Trace 2; red color indicates the current active trace is Trace 3.

  1. The distance of current active cursor and the distance of event point in event table are both calculated with reference origin as originating location, the distance display at the left of reference origin is negative value and the distance at the right is positive value.
  • The factory default reference origin is the test port of OTDR, i.e. Test origin.
  • If a reference origin is set, the instrument will save it automatically, and it will call out the position of saved reference origin at startup next time.
  1. Three traces are available simultaneity on the instrument, respectively represented by Trace 1, 2 & 3.
  • The analysis, movement and calculation of trace only point to current active trace.

Note:

  • The serial number of current active trace is consistent with that displayed on trace switch button ( ).
  • The line color of the trace of current serial number is consistent with the graph color on button and the icon color as shown.
  • Using the trace switch button in the menu bar can switch among Trace 1, 2 & 3.
  • Only the traces with the same test range can be displayed at the same time.

Description of Event List Window

In the main screen displayed above, press the button【Analyse】to analyze the current trace and display event list. If the current event table has contents, press the button 【Event Table】to show event list. The event list window is shown below:

(2) No: The serial number of current event point.

(3) Dis (km): The distance between this event and reference origin.

(4) Average (dB/km): The average loss of the optical cable before the current event point.

(5) Splice Loss (dB): The splice loss measured at current event point * indicates the current tested splice loss value is larger than the set pass threshold of splice loss.

(6) Reflection Loss (dB): The reflection loss measured at current event point * indicates the current tested reflection loss value is larger than the set pass threshold of reflection loss.

(7) Link (dB): The total loss of the fiber section from current event point to reference origin.

Overview of Menu Structure and Function

Structure and Function of First Menu

Main screen displays main menu bar by default, including seven menu buttons as shown in below figure:

All menu buttons of first menu bar

All the button functions on the menu bar are described as follows: (Pressing corresponding menu item will realize the following functions).

【System】: Enter system sub-menu to realize the functions of system information display, touchscreen calibration, system program update, help information display and return to main screen (interface of operating module selection), etc.

【Setup】: Enter parameter setup sub-menu to realize the functions of OTDR test condition setup, reference origin setup, optical cable information setup, etc.

【Start】: This button is used to control optical fiber test of OTDR or stop test. Pressing this button turns the button to 【Stop】, then, OTDR will test the optical fiber under test according to the set test condition; Pressing this button again turns the button to【Start】and OTDR will stop test If in average test, auto test and dead zone test mode, the test is finished, this button will turn to 【Start】automatically and meanwhile OTDR stops test.

【File】: Enter file operation sub-menu to realize the functions of reading, saving, deleting file, printing and transferring file and clearing the trace displayed on screen, etc.

【Analyse】: Analyze the current trace to give event list. If event point is unavailable, a prompt will be given.

【Event Table】: Displaying event list and event operation sub-menu to realize the functions of deleting, adjusting and adding event point and modifying event analyze threshold, etc.

【Trace 1】: Display trace selection window in which the trace number can be selected to switch the current active trace among Trace 1, 2 & 3. Trace 1 is blue; Trace 2 is dark green and Trace 3 is red.

Brief Introduction of Operating Sub-window Menu

Press menu buttons in the main menu bar to enter different sub-menus (or executing corresponding function), press different sub-menu buttons in each sub-menu bar to eject corresponding operating window to finish different functions, such as, saving, reading, deleting and copying file and viewing event list, setting OTDR test parameters, displaying system and help information, etc.

How to Use

Testing Optical Fiber Chain

  • Operation steps are as follows:
  • Select test wavelength.
  • Set test mode, etc. test conditions.
  • Clean the optical fiber under test.
  • Connect the optical fiber under test to corresponding OTDR optical output port.
  • Press to obtain the waveform trace of the optical fiber under test.
  • After test stops:
  • If in auto test mode or auto analyse after sampling, the instrument will analyze trace automatically, mark event points according to the set loss analyse threshold and give an event list.
  • Otherwise, please press the button【Analyse】in main menu bar, the instrument will analyse trace and then it will mark event points according to the set loss analyse threshold and give the event list.
  • After trace analyse is finished, view test results in event table.

1.1 Description of Test Modes, Parameters and Items

Before testing optical fiber link, please set the test mode of OTDR and all test parameters first. The setup window of OTDR test conditions are as shown in below figure.

OTDR test condition setup window

1.1.1 Test Modes of OTDR

The test modes of OTDR include: auto test, real-time test, average test and dead zone test.

  • Auto Test:

In auto test mode, press , OTDR will automatically adjust test conditions to test the link of optical fiber under test, after which it will automatically analyze trace and then display trace and event list in main screen.

  • Real-Time Test:

In real-time test mode, press or press the button 【Start】in main menu bar (then, the menu button 【Start】 turns to 【Stop】), OTDR will perform real-time scanning test to the link of optical fiber under test according to currently set test conditions, the trace in main screen will be refreshed continuously, and until is pressed again or is pressed or 【Stop】in main menu bar is pressed (then, the menu button 【Stop】turns to 【Start】, OTDR stops test.

  • Average Test:

When OTDR is in average test, press or press the button【Start】in main menu bar (then, the menu button 【Start】 turns to 【Stop】), OTDR will perform average test to the link of optical fiber under test according to set test conditions. The trace in main screen will be averaged continuously, and until the average times displayed on interface is equal to the set one, OTDR stops test (then, the menu button 【Stop】turns to 【Start】. Also can be pressed again or is pressed or 【Stop】 in main menu bar is pressed (then, the menu button 【Stop】 turns to 【Start】) to stop test.

  • Dead Zone Test:

The test conditions are fixedly set to: range of 400 m, pulse width of 5 ns and attenuation of 20 dB. Minimum test dead zone can be obtained in this test mode, but the distance that can be tested is also the shortest one. Usually, use this test mode to measure shorter optical fiber, such as optical fiber jumper.

1.1.2 Test Parameters of OTDR

The test parameters of OTDR include: wavelength, range, pulse width, attenuation, average times, index of refraction, helix, etc.

  • WL: Used to set the test wavelength of OTDR.
  • The number of wavelengths available for OTDR is determined by the module of the instrument, which are 4 for selection maximally.
  • In average, auto and dead zone test mode, it is allowed to select more than one wavelength. In test, the instrument will perform test in turn under each selected wavelength until all the selected wavelengths are tested before it stops. The instrument allows three wavelengths to be selected for test maximally simultaneity.
  • When the module of instrument has single mode and multimode modules at the same time, please pay attention to connecting the optical fiber under test into corresponding test port to ensure correct trace.
  • Range (km): Used to set the range of scanning trace. GAO-OTDR-102 ranges
  • Pulse (ns): Used to set the width of laser pulse. Longer pulse width can test longer fiber and provides better SNR, smoother trace and lower resolution; shorter pulse width provides higher resolution, but it tests shorter distance and results in worse SNR.
  • Att. (dB): Used to set attenuation of signal. Attenuation can be set to 0dB, 5dB, 10dB, 15dB and 20dB. If value of Att. is minimum (such as 0dB), the fiber length to be tested is maximal, but the near end of fiber may be saturation (A straight line is displayed in screen); If the value of Att. is maximal (such as 20 dB), the fiber length to be tested is minimum and trace SNR is worse but dead zone will be smaller.
  • Times:

It is used to set the max. average times of average and auto test. The value of times is between 1 and 4000 in average mode. The value of times is between 5 and 20 in auto test mode. When entirely display trace test function is selected, the average times are 1 or 10 multiple, such as 1, 10, 20, 30, etc.

  • IOR:

The IOR of optical fiber and optical cable can be obtained from production factory. The value of IOR is set to: 1.00000~2.00000.

Inaccurate IOR setup will result in inaccurate optical fiber length.

  • Optical Cable correction: The setup of optical cable correction coefficient depends on the errors between optical fiber length and optical cable length after optical fiber is made into cable. It can be obtained from optical cable production factory. It can be set to: 0.80000-1.00000. The default value is 1.00000.

Inaccurate optical cable correction setup will result in inaccurate optical cable length.

  • Length Unit: The instrument allows users to set length unit to km or kft. The default length unit is km.
  • Auto Analyse after Sampling: When this item is selected, in real-time, average and dead zone test mode, the instrument will analyze trace, mark event point and give event list automatically after stopping test.

If this item is not selected, in real-time, average and dead zone test mode, the instrument will not analyze trace after stopping test, only after the button 【Analyse】 is pressed in the first menu, the instrument will analyze trace, mark event point and give event list.

  • Locking Maker A & B: Selecting this item will lock the distance between marker A and B, so moving one of them will move both and meanwhile they will keep the distance unchanged. If this item is not selected, when moving one cursor, the other cursor will not move. If this item is only valid during average loss test and reflection loss test, during testing splice loss, four cursors will appear and this item become invalid. In the edit state (adding or adjusting event point) of event table, cursor will be unlocked automatically.
  • On-line Test: This item is only valid in the module with filter. When it is selected, the instrument will connect the filter in optical assembly, and the time, the optical fiber link with active optical signal can be measured in wavelength of 1,625nm or 1,650nm.
  • Low Battery Alarming: In use of battery, when this item is selected, it will give alarm message to remind users of too low battery capacity if the batter capacity is less than 5%.
  • Entirely Display Trace Test Mode: If this item is selected, in measurement of longer optical fiber, larger attenuation (such as 10dB or 15dB) can be used to measure the optical fiber trace near the link under test (i.e. near OTDR test port), but the distal trace will be submerged in noise; smaller attenuation (such as 0dB) can be used to measure the optical fiber trace far away from the link under test, when the proximal trace is saturated to a straight line, the proximal trace cannot be displayed as shown in below figure:

Fiber Link measurement in not entirely display trace test mode

After this item is selected, the instrument will adjust test pulse width and attenuation automatically and display the complete trace of fiber link under test from proximal end to end on screen as shown in below figure:.

Fiber link measurements in full range trace test mode

1.1.3 Test Items of OTDR

The test items of OTDR can be: average loss, splice loss and reflection loss.

  • Average Loss: Then, the test results displayed on OTDR main screen are: loss between A and B distance between maker A & B and average loss of fiber section between marker A & B as shown in below figure:

Average loss tests

Loss (A-B): 26.754 dB: Loss between marker A & B

Att: 0.179 dB/km: Average loss of fiber section between marker A & B

Dis (A-B): 109.12 mi (175.62 km): Distance between marker A & B

  • Splice Loss: Then, the OTDR main screen will display four markers, and meanwhile test results will include the splice loss at the connection point of marker A, the average loss of previous fiber section before connection point and the average loss next fiber section after connection point as shown in below figure:

Att (a-A): 0.220 dB/km: Average loss of fiber section of marker a & A
(B-b): 0.000 dB/km: Average loss of fiber section of marker B & b
Splice: -1.193 dB: Splice loss of connection point of marker A
Reflection Loss: OTDR main screen displays the reflection loss of fiber reflection peak of marker A & B and the distance between marker A & B.!

1.1.4 Event Analyse and Pass Threshold

In the setup interface of OTDR test conditions, event analyses and pass threshold can be set.

  • Loss Analyse Threshold: During trace data analyse, when the calculated splice loss of event point is larger than loss analyse threshold, this event point will be marked, and otherwise, it will be ignored automatically.
  • Splice Loss Pass Threshold: In event list, when the calculated splice loss of event point is larger than the set splice loss pass threshold, the splice loss value will be marked with *.
  • Reflection Loss Pass Threshold: In event list, when the calculated reflection loss of event point is larger than the set reflection loss pass threshold, the reflection loss value will be marked with *.
  • Fiber Breakpoint Threshold: If the splice loss of event point is larger than the set fiber breakpoint threshold, this point will be taken as fiber breakpoint, all the event points after that will be ignored and not be displayed in the list.

1.2 Set OTDR Test Conditions

Set OTDR test conditions at the stopping test state.

1.2.1 Enter OTDR Test Condition Setup Window

Enter OTDR test condition setup window through three methods:

  • Press the test condition display area in the main screen to enter OTDR test condition setup window.

  • Press the【Setup】menu in the main menu bar to enter the setup sub-menu, and then press 【Parameter】menu to enter OTDR test condition setup window.

  • Press the【Setup】key on the following panel to enter OTDR test condition setup window.

1.2.2 Set Test Mode

Modify and set test mode through the following description:

Set test mode

  • Touchscreen Operation: Press “Mode” option bar, the active cursor will jump to this option bar; press the button on this option bar to eject a drop-down window with all options, as shown in the above figure. Now press the option to be set. Then press the 【Enter】 menu on the option bar to confirm setting and exit from the setup interface back to the main screen; press【Return】menu on the menu bar to cancel the setting and exit from the setup interface back to the main screen.
  • Key Operation: use to move active cursor ( ) to “Mode” option; then use to change and set the mode option. Finally press key to confirm the setting and exit from the setup interface back to the main screen; press key to cancel the modification and return to the main screen.

1.2.3 Set Test Item

Modify and set the OTDR test item through the following description:

Set test item

(1) There are two markers (marker A and marker B) when the test item is set as average loss or reflection loss.

(2) There are four markers (marker a, marker A, marker B and marker b) when the test item is set as splice loss.

1.2.4 Set Test Wavelength

Modify and set OTDR test wavelength through the following description:

Set test wavelength

The currently displayed optional wavelength is different with the configurated module of the instrument; there are four wavelengths for optional at most.

1.2.5 Set Test Range

Modify and set OTDR test range through the following description:

Set test range

(1) The values of range are 400m, 800m, 1.6km, 3.2km, 8km, 16km, 32km, 64km, 128km, 256km and 512km.

(2) It should be increased to a value greater than the fiber length (best twice than the fiber length).

1.2.6 Set Test Pulse Width

Modify and set the OTDR pulse width through the following description:

Set test pulse width

(1) It is allowed that the selected pulse width is in relation with the test range.

(2) A larger pulse width can test the longer fiber, but resulting in less resolution. A smaller pulse width provides higher resolution, but shorter test distance.

1.2.7 Set Test Attenuation

Modify and set the OTDR test attenuation through the following description:

Set test attenuation

(1) When other test conditions are the same, the value of attenuation is set as 0dB, the testable optical fiber distance is longest, the signal to noise ratio of trace is relative good, but it may make the OTDR near-end trace saturated so that the near-end trace cannot be observed.

(2) When other test conditions are the same, the value of attenuation is set as 20dB, the testable optical fiber distance is longest, and the signal to noise ratio of trace is poor, but it can achieve smaller test blind zone.

(3) Under the manual test mode (that means real-time test mode and average test mode), the test attenuation should be selected according to the optical fiber to be tested.

(4) When “Track history test” Mode is selected, and the test range is not less than 64km (that means when measuring relative long optical fiber link), the instrument will automatically adjust attenuation setup and display the complete optical fiber link near-end and far-end trace on the display.

Note!

1.2.8 Set Average Times

Modify and set the OTDR average times through the following description:

Set average times

1.2.9 Set IOR

Modify and set the OTDR IOR through the following description:

Set IOR

1.2.10 Set Helix

Modify and set the OTDR helix through the following description:

Set helix

(1) Inaccurate helix will result in inaccurate measured optic cable length.

(2) Helix range: 0.80000~1.00000.

1.2.11 Set Length Unit

Modify and change OTDR length unit through the following description:

Set length unit

1.2.12 Set Auto Analyse after Sampling

Modify and set the OTDR auto analysis after sampling through the following description:

Set auto analyse after sampling

1.2.13 Set to lock Marker A, B

Modify and set the OTDR lock of cursor A, B through the following description:

Set to lock cursor A, B

1.2.14 Set On-line Test

Modify and set the OTDR on-line test function through the following description:

Set on-line test

1.2.15 Set Entirely Display Trace Test Mode

Modify and set the OTDR on-line test function through the following description:

Set entirely display trace mode

1.2.16 Set Loss Analyse Threshold

Modify and set OTDR loss analysis threshold through the following description:

Set loss analysis threshold

1.2.17 Set Splice Loss Pass Threshold

Modify and set the OTDR splice loss pass threshold:

Set splice loss pass threshold

1.2.18 Setting Reflection Loss Pass Threshold

Modify and set the OTDR reflection loss pass threshold:

Set reflection loss pass threshold

1.2.19 Set Fiber Breakpoint Threshold

Modify and set the OTDR fiber breakpoint threshold through the following description:

Set fiber breakpoint threshold

1.3 Test Fiber Link

1.3.1 Auto Test

  • Clean the tested optical fiber end face and connector, make sure the tested optical fiber is reliable and connected into the OTDR test port.
  • Enter OTDR test condition setup interface. (See P27 for the detail of the operation )
  • Use / to move active cursor ( ) to “Mode” option or press “Mode” option directly through touchscreen to select the OTDR test mode: Auto Test.
  • Operate it the same as above, set Times, Wavelength, IOR, Helix and all Threshold.
  • Confirm OTDR Parameter Setting and return to main screen. Press key, the instrument will automatically set test range, pulse width and attenuation, scan optical fiber to be tested and display the trace on the operating interface.
  • After testing optical fiber trace, the instrument will automatically stop scanning and analyze the trace, analyze threshold value according to the setting loss, mark the event point on the trace, at the same time display the event point information on the event table.

(1) The bigger average times is set in the auto test, the longer time testing of trace needs, the signal to noise ratio of testing trace in convenience for the analysis of event point.

1.3.2 Manual Test

  • Clean the end face of the optical fiber to be tested, make sure the optical fiber to be tested is connected into OTDR test port reliably.
  • Enter OTDR test condition setup interface. (See P27 for the detail of the operation )
  • Use / to move active cursor ( ) to “Mode” option or press “Mode” option directly through touchscreen to select the OTDR test mode: Real-Time Test or Average Test or Dead Zone Test.
  • Operate it the same as above, set test Wavelength, Pulse Width, Att. IOR, Helix and all Threshold. When the test mode is average test or dead zone test, the average times should be set.
  • Confirm OTDR parameter setting and return to main screen. Press key, the instrument will scan optical fiber to be tested according to the set test mode and test parameter and display the trace on the operating interface.
  • Press key to stop sweep test at any time. If the test mode is average test or dead zone test, the average times displayed in the trace displayer area is equal to the set average times, the instrument will automatically stop testing.
  • Press【Analyse】menu item on the main menu bar, the instrument will automatically analyze the trace and give event table according to the set event threshold. If it is set “Auto analyse after sampling”, when stopping test, the instrument will automatically analyze the trace.
  • It can also set the proper mark point position through setting test item, check the distance and loss information of the optical fiber to be tested on the trace and result display area.

(1) Under the real-time test mode, the instrument will make real-time scan for the change of the optical fiber to be test, but not make average handling for it.

(2) Under average test mode, after the instrument scanning tests the trace of optical fiber to be tested, make average superposition treatment to the trace continuously according to the set average times.

(3) Average test mode can achieve trace of higher signal to noise ratio. Under the same condition, the noise content in the trace received from average test is lower than that of real-time test, and the test result is more precise.

1.4 Analyzing Waveform Trace and Checking Event Table

Under the mode of “Auto Test”, after testing, it will conduct a trace analysis automatically and list the event information in the event table.

Under the modes of “Real Time Test”, “Average Test” and “Dead Zone Test”, after stopping the test, press 【Analyse】 in the main menu bar and it will conduct a trace analysis. If “Auto analysis after sampling” is set, after stopping test, the instrument will conduct a trace analysis about the trace. After the trace analysis is finished and the event point is found, it will display the event information in the event table of the main screen in accordance with the every set event threshold; and at the same time, it will mark the location of the event point in the test trace and display the submenu bar of the event table.

1.4.1 Event Table in Main Screen

The event table in the main screen is shown as follows. Here press key and you can check information of all events in the event table one by one.

Event list window

1.4.2 Sub-window of Event List

After the trace analysis is done, you can check the content of the whole event table in the sub-window of the event list. (If after the trace analysis is done and no event point has been found then the event list will be blank.)

1.4.3 Add Event Points

Press the menu item of【Add】 in the submenu bar of the event table and it will display the operating interface of adding event points, as shown in the following Figure.

Operation interface of adding event points

1.4.4 Delete Event Points

Press the menu item of【Delete】 in the submenu bar of the event list and it will delete the

event point selected by the current cursor bar in the event list.

1.4.5 Adjust Event Points

Press the menu item of 【Adjust】 in the submenu bar of the event list and it will display the operating interface of adjusting the added event points. Press to change the type of the event point, or press the drop-down list option of the event point type on the touchscreen and select the type of the event point.

1.4.6 Set Threshold

Press the menu item of 【Threshold】 in the sub menu bar of event table and it will directly enter the setup interface of OTDR parameters. In this interface the event analysis threshold can be set.

  1. Measure Fiber Length and Loss

Besides pressing the 【Analyse】 button or setting “ Auto analysis after sampling” to realize analyzing the length and loss information of the event point in the test trace automatically, you can also observe and analyze the length, loss, etc information of the tested fiber by the method of manually setting the mark point.

2.1 Measure Fiber Length

To measure the length of any event point (or fiber end), the operation steps are as follows:

  • Move the current active cursor around the event point (or reflection peak of the end of the fiber).
  • Zoom the waveform trace to the maximum both in the horizontal and vertical direction.
  • Well adjust the location of the active cursor and move it to the event point (or the take-off point of the reflection peak of the fiber end).
  • The length of the mark point where the active cursor locates displayed on the screen is the distance between the event point (or the fiber end) and OTDR output terminal.

Fiber length test

3.2 Measure Fiber Average Loss

To test the average loss of some section of the fiber, the operation steps are as follows:

  • Set the test item as average loss test. At this moment there will be two cursors in the main screen which are cursor A and cursor B.
  • Move Cursor A and B to any two points in the linear zone of the tested fiber section. (In order to ensure the accuracy of the test result, when test relatively long fiber, please set that the distance between the two mark points should be at least greater than 500 m.)
  • At this moment the average loss value displayed on the operating window is the average loss of the fiber section which was to be tested.

Average loss test

Loss (A-B):0.600 dB: the loss between cursor A and B

Average loss: 0.145 dB/km: the average loss of the fiber section where cursor A and B locate.

Distance (A-B): 2.30 mi (3.71491 km): the distance between cursor A and B

3.3 Measure Splice Loss

To measure the splice loss, the operation steps are as follows:

  • Set the test item as splice loss test. At this time there will be 4 cursors in the main screen (they are cursor a, cursor A, cursor B and cursor b in turn).
  • Expand the wave form in the horizontal direction and locate the cursor A at the end of the fiber linear zone which is ahead of the tested connection point.
  • Locate the small cursor (namely cursor a) which is ahead of the cursor A at the initial end of fiber linear zone which is ahead of the tested connection point.
  • Locate the cursor B at the end of the fiber linear zone which is ahead of the tested connection point.
  • Locate the small cursor (namely cursor b) which is after the cursor B at the end of fiber linear zone which is after the tested connection point.

Splice loss test

Average loss (a-A): 0.196 dB/km:The average loss of the fiber section of cursor a and A

(B-b): 0.175 dB/km: The average loss of the fiber section of cursor A and b

Splice loss: 0.343 dB: The splice loss of the connection point of cursor A

3.4 Measure Reflection Loss

To test the reflection loss of a certain connection point, the operation steps are as follows:

  • Set the test item as splice loss test. At this moment there will be two cursors in the main screen which are cursor A and cursor B.
  • Expand the wave form in the horizontal direction and set the mark point A at the end of the linear zone which is ahead of the tested reflection point.
  • Locate the mark point B at the top of the reflection event point, as shown below:
  • At this moment the reflection loss value displayed on the operating window is the reflection loss of the tested reflection point.

Reflection loss test

Distance (A-B): 0.01 mi (0.03440 km): The distance between cursor A and cursor B

Reflection loss: 42.472 dB: The reflection loss of reflection peak of cursor A and cursor B

File Management

Under the main menu bar of the main screen, press the menu item of 【File】 and it will enter the submenu item of file operation as shown below:

Submenu of file operation

Save Waveform File

Under the submenu bar of the file operation, press 【Save】 or press and it will pop operating window for file save, as shown below:

Operating window for file storage

Read Waveform File

Under the submenu bar of the file operation, press the menu item of 【Open】 and it will display the operating window of reading file on the screen. As shown in the figure below. After entering the operating window of reading file, the default active cursor locates at the file list.

Operating window of reading file

Delete Waveform File

Under the submenu bar of the file operation, press the menu item 【Delete】 and it will display the operating window of deleting files on the screen as shown in the figure below. The operating interface is the same as the one of reading file and the only difference between them is the different icon indication, as shown in the following figure.

Operating window of deleting file

Copy the Files between OTDR and USB Disk/SD Card

Under the submenu bar of the file operation, press the menu item 【Transfer】 and it will display the operating window of transferring file on the screen as shown below:

Operating window of file transfer

Clear the Traces Displayed on the Screen

Under the submenu item of the file operation, press the menu item of 【Clear】and it will clear the tested trace and event point information displayed on the screen.

Set Fiber Information

Under the main menu bar of the main screen, press【Setup】to enter the submenu item of setting. In this sub-menu item, press【Parameter】to enter the operating window of OTDR

parameter setup. Press 【Cable】 and it will display the operating window of fiber information setup, as shown below:.

Window of cable information setup

Input window of fiber information

Set Reference Origin

Press 【Setup】 menu in the first menu bar of main screen into the Setup Sub-Menu. Here, press 【Reference Point】, and prompt window appears, prompting user to set the reference origin, as shown below:

Prompt Message for Setting Reference Point

Trace Selection and Comparison

User is allowed to display three traces on instrument to make trace comparison. But test range of the three traces must be the same, otherwise comparison is not allowed. User is allowed to set multiple wavelength tests on instrument.

Press trace selector button, the trace number selection window appears. Trace selected will become the currently active trace, as shown in the following figure:

Trace Selection Window

View System Information

Press 【System】 in the first menu bar of main screen into system sub-menu. Press 【Information】 menu in the sub-menu bar, system information sub-window.

Print Test Report

Print setting window

Help

Press 【System】 in the first menu of main screen into system sub-menu. Press 【Help】 in this sub-menu bar, the Help Information sub-window appears as shown in the figure below. This window displays brief help information and precautions.

System Upgrade

Operational procedures for system upgrade are as follow:

  • Create a folder named OTDR under the root directory of USB disk or SD card.
  • Save the system upgrading files in the folder named OTDR abovementioned. Connect USB disk or SD card to USB port or SD card slot of the device.
  • Press 【System】 menu in the first menu of main screen into setup sub-menu. Press 【Upgrade】 in the sub-menu bar, upgrade prompting message box appears.
  • Press 【Enter】 button in prompting message box or press into system upgrading interface.
  • According to prompt on display interface, press, system upgrade will act to upgrade and update system files of instrument. After upgrade, user has to power up again.

Caution!

Do not power off or pull USD disk or SD card out during system upgrade, otherwise it will cause system upgrade failure and make instrument incapable of operating normally.

Calibrating touchscreen

Operational procedures for calibrating touchscreen are as follow:

  • Press 【System】 menu in the first menu of main screen into setup sub-menu.

Press 【Touch-Cal.】 in the sub-menu bar.

  • Click the center of cross cursor with touch pen when the cross cursor is displayed.
  • Click the touch screen, then calibrating touchscreen is finished.

Common Faults and Treatment

Below are the possible faults of instrument and solutions:

Fault and Treatment

Faults Causes Solutions
Instrument fails to start Out of battery Charge the battery
Not connected to external power supply Use AC/DC Adapter to supply power.
Button fails to respond Check if any button is kept pressed. Make sure no button is kept pressed.
Length of optical fiber measured is not accurate a. Refractive index of optical fiber is not set accurately

b. Fiber cable’s coefficient of correction is not set accurately

a. Set the refractive index of optical fiber to the refractive index calibrated by fiber manufacturer.

b. Set fiber cable’s coefficient of correction to 1.0000 or to the coefficient of correction calibrated by fiber cable manufacturer.

Average loss value of optical fiber measured is not accurate a. Large error in length of the tested optical fiber.

b. Front end of the test trace tails too long

a. Refer to the above item to measure the length of optical fiber accurately.

b. Clean splice of the tested optical fiber or add in a little matching fluid and retest the trace afterwards.

There isn’t test waveform displayed on screen, except for the front end reflection peak; or the front end reflection peak has long tailing Fiber end is polluted Wipe the fiber end with absolute ethyl alcohol.
Fiber end inside the optical output port connector of instrument is polluted Take down the optical output port connector and wipe it with the absolute ethyl alcohol.
Ceramic core inside optical output port connector (flange) is damaged, which causes crack or breakage. Replace the flange.
Type of optical fiber splice does not match End type of the optical fiber splice tested must match with that of the OTDR light output splice. Otherwise it must use the patch cord for switch over.

Trace test and failure cause analysis

If the result of trace test and analysis is widely different from expected, or the expected result is not achieved, it may be caused by one of the following:

  • Failed to obtain the test trace of optical fiber

If the test trace only shows front end reflection peak, but fails to obtain the linearity trace which may reflecting characteristics of optical fiber, please check:

  • If the type of tested fiber end matches with the type of fiber end at OTDR optical output port.
  • If the fiber end is polluted.
  • If the optical output flange of OTDR is cracked.
  • Check the near end of tested fiber link for high loss with the VFL function.
  • Near end of the test trace has severe tailing.

Try in case severe tailing is observed on falling edge of the near end reflection peak of the test trace:

  • Use absorbent cotton ball with proper amount of absolute ethyl alcohol to clean the tested fiber end and optical output port end of OTDR.
  • Adopt smaller pulse width to retest the trace (note: please select average test mode and set certain average time here).
  • Under the pulse width currently set, use larger attenuation to retest the trace (note: please select average test mode and set certain average time here).
  • Distance between event points on test trace is too small. Try to find if adjacent event points have been omitted:
  • Adopt smaller pulse width to retest the trace (note: select average test mode and set certain average time here).
  • Set certain average time and adopt average test mode to perform test so as to raise the signal to noise ratio of trace.
  • Poor signal to noise ratio of the test trace

Poor signal to noise ratio of test trace will affect the accuracy of trace analysis. Here please try:

  • In automatic test or average test mode, appropriately increase the value of average time.
  • In average test mode, after setting proper test range, select larger test pulse width to test again.
  • In average test mode, after setting proper test range and test pulse width, please select smaller test attenuation to test again (such as 10 dB attenuation).
  • OTDR test parameters are set incorrectly.

If the optical fiber length, etc. values are measured materially different from the actual value, please check:

If refractive index and fiber cable’s coefficient of correction are set in conformity to standard values of the tested optical fiber or fiber cable.

Unconformable set of the refractive index has a strong impact on test value of the length of tested optical fiber.

Cleaning Optical Output Port

During using the instrument, please pay attention that:

  • Always keep the optical output port clean by using absolute ethyl alcohol regularly.
  • Please cover the dust cap after use, and the dust cap must be kept clean as well.
  • User must clean the flange connector of optical output port regularly. In case of finding any crack on the ceramic core inside flange, please replace flange in time.

Effect of cleaning fiber splice and optical output port

  • Optical fiber cores are very small in size. Dust and particles adhering to fiber splice and optical output port may cover a part of fiber core at output port, as a result will reduce the performance of instrument.
  • Dust and particles may result in wear and tear of the fiber splice end at output port, which will reduce the test accuracy and repeatability of instrument.

Follow below safety principles before cleaning

  • Make sure that you have disabled power supply of instrument when you are cleaning.
  • Disobeying stipulated procedures for control, regulation and operation may cause dangerous radiation injury.
  • Make sure the laser source is in non-operating state when cleaning any optical interface.
  • Do not view any optical output port directly when instrument is operating so as to prevent ocular damage.
  • Tools used for cleaning optical output interface and splices
  • You may use tools such as optical fiber cleaner and optical fiber cleaning stick to clean the optical output port and splices.
  • If there is a lack of the abovementioned professional tools, please prepare: Absorbent cotton ball and absolute ethyl alcohol, etc.
  • Procedures for cleaning optical output interface and splices
  • Turn off power supply of instrument.
  • Fully unscrew the flange cap.
  • Gently draw the flange outwards, see as following figure:

  • After cleaning, gently connect the flange to optical output port and screw the flange cap down.

Description of Rechargeable Battery

The battery in GAO-OTDR-102 is special lithium battery.

Batter Indicator and Charge Indicator

When the instrument is powered on, the battery indicator at lower right shows the current remaining capacity of battery, and charge indicator also appears. Meanwhile, the system information window also shows the percentage of current remaining capacity of battery.

When the charge indicatorappears, it indicates the instrument has been connected with external power supply and is using the external power supply to work, and meanwhile the battery is charged. When the charge indicatordoes not appear, it indicates the instrument is using internal battery to work.

When the instrument is working with external power supply for charge, the power button is red; when the battery is charged fully, the power button is green; when the external power is cut off, the power button indicator lamp goes out.

Charging the Battery

(1) The temperature range of battery charge is: 41 °F~104 °F (5 °C~40 °C). It will stop charging automatically in case of exceeding the temperature range during charging, which will cause that the battery is not fully charged. Over high temperature will cause damage to the battery and affect its life.

(2) The charging time is less than or equal to 6 hours when this instrument is off.

(3) The charging time is less than or equal to 8 hours when the instrument is on.

(4) Overlong charging time will affect battery life and even cause damage to it.

Precautions

In order to prevent the rechargeable battery from excessively discharging, the battery inside the instrument should be charged in time through external power adapter.

Long-time excessive discharge of the rechargeable battery will affect battery life and even cause damage to it. Charge indicator Battery indicator

Composition of the Instrument

Basic Composition of GAO-OTDR-102

Item Name Quantity
Mainframe GAO-OTDR-102 1
Standard

Accessories

Power adapter 1
Power line 1
User’s Guide 1
CD 1
Multifunctional fiber adapter SC, ST 1
Engineering plastic case 1

Ordering Information

Optional Modules of GAO-OTDR-102

Module No.1 Operating Wavelength Optical Fiber Type Dynamic Range 2 Event Dead Zone3 (m) Attenuation Dead Zone3 (m)
GAO-OTDR-102-C1 1,310 nm/1,550 nm Single mode 42 dB /40 dB 2/2  10/10
GAO-OTDR-102-C3 1,310 nm/1,550 nm Single mode  37 dB /35 dB 1/1  10/10
GAO-OTDR-102-C8 1,310 nm/1,550 nm  Single mode 45 dB /43 dB 1/1  10/10
GAO-OTDR-102-E3 1,310 nm/1,550 nm/1,625 nm (built-in filter) Single mode 37 dB/36 dB/34 dB/ 1/1/1 10/10/10

Optional Accessories

No. Name Model or Specification Explanation
1 USB disk 2 GB Save test data
2 SD card 2 GB Save test data
3 Data synchronization

transmission line

Communicate with computer
4 Standby battery pack Standby battery
5 FC/SC, FC/ST adapter Test the optical fiber of

corresponding joint

6 Optical fiber patch cord FC/UPC to FC/APC Optical fiber patch cord
7 Optical fiber patch cord FC/UPC to FC/APC Optical fiber patch cord
8 Optical fiber patch cord FC/UPC to FC/APC Optical fiber patch cord


Content missing