Description
Overview
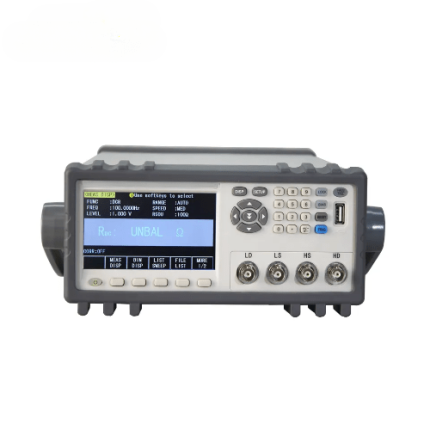
GAOTek’s OTDR with PON Online Test, Multimode and Fiber Microscope is a new generation of intelligent testing devices for fiber communications systems. GAO-OTDR-115 OTDR is specially designed for tough outdoor applications. IP65 protection level, lightweight, easy operation, low-reflection LCD and long battery life makes it perfect for the field testing. This device is a highly integrated platform with features like four module slots, large 7-inch color screen (with a touchscreen option), a high-capacity Lithium-Ion battery, an optional microscope (through universal serial bus [USB] port), and built-in optical test functions, such as PON test module, visual fault locator (VFL), optional power meter and laser source. The versatile features of this device make it suitable for the installation, turn-up, and maintenance of FTTx/Access optical networks.
Features
- Integrated design, smart and rugged.
- IP65 protection level, outdoor enhanced.
- 7-inch anti-reflection TFT-LCD display with LED backlight (touch screen function is optional).
- A high-capacity Lithium-Ion battery with 12 hr operating time.
- Built-in VFL.
- PON online test module (1625nm) (optional).
- Multi-mode test module (850/1300nm) (optional).
- Optional built-in power meter to verify the presence of the signal.
- Optional built-in Laser source to verify the total loss of the optical network.
- Optional fiber inspection probe to facilitate the Inspection before the connection.
- Support multi-language display and input.
- Can measure Splice loss, Connector loss, Fiber attenuation, Reflection of points, Link optical return loss and distance to fiber events etc.
- 4GB large internal memory space; can store more than 40,000 group of results.
Applications
- FTTX test with PON networks
- CATV network testing
- Access network testing
- LAN network testing
- Metro network testing
- Lab and Factory testing
- Live fiber troubleshooting
Technical Specifications
TEST PARAMETERS | |
Testing Wavelength
(MM: ±20 nm, SM: ±10 nm) |
Wavelength will vary with different module number. Please refer to the “Ordering Information” Table for more detail. |
Dynamic Range (dB)1 | Dynamic range will vary with different module number. Please refer to the “Ordering Information” Table for more detail. |
Event/Attenuation Dead-zone (m)2 | Event/Attenuation Dead-zone will vary with different module number. Please refer to the “Ordering Information” Table for more detail.
|
Pulse Width |
Single mode: 3 ns, 5 ns, 10 ns, 20 ns, 50 ns, 100 ns, 200 ns, 500 ns, 1 μs, 2 μs, 5 μs, 10 μs, 20 μs |
Multimode: 3 ns, 5 ns, 10 ns, 20 ns, 50 ns, 100 ns, 200 ns, 500 ns, 1 μs, 2 μs | |
Testing Distance | Single mode: 100 m, 500 m, 2km, 5 km, 10 km, 20km, 40 km, 80 km, 120 km, 160 km, 240 km |
Multi-mode: 500 m, 2 km, 5 km, 10 km, 20 km, 40 km | |
Sampling Resolution | Minimum 5 cm |
Sampling Point | Maximum 128,000 points |
Linearity | ≤0.05 dB/dB |
scale Indication | X axis: 4m ~ 70m/div, Y axis: Minimum 0.09dB/div |
Distance Resolution | 0.01 m |
Distance Accuracy | ±(1 m + measuring distance×3×10⁻⁵+sampling resolution) (excluding IOR uncertainty) |
Reflectance Accuracy | Single mode: ±2 dB, multi-mode: ±4 dB |
IOR Setting | 1.4000 ~ 1.7000, 0.0001 step |
Units | Km, miles, feet |
OTDR Trace Format | Telcordia universal, SOR, issue 2 (SR-4731) OTDR: User selectable automatic or manual set-up |
Testing Modes | · Visual fault locator: Visible red light for fiber identification and troubleshooting
· Light source: Stabilized Light Source (CW, 270 Hz, 1 kHz, 2 kHz output) · Field microscope probe |
Fiber Event Analysis | · Reflective and non-reflective events: 0.01 to 1.99 dB (0.01 dB steps)
· Reflective: 0.01 to 32 dB (0.01 dB steps) · Fiber end/break: 3 to 20 dB (1 dB steps) |
Other Functions | Real time sweep: 1 Hz Averaging modes: Timed (1 to 3600 sec.) Live Fiber detect: Verifies presence communication light in optical fiber Trace overlay and comparison |
Visual Fault Locator (VFL) Module ( Standard function) | |
Wavelength (±20nm) | 650 nm |
Power | 10 mw, CLASSIII B |
Range | 12 km |
Connector | FC/UPC |
Launching Mode | CW/2Hz |
Optical Power Meter (OPM) Module (Optional function) | |
Wavelength Range (±20nm) | 800 nm ~ 1700 nm |
Calibrated Wavelength | 850 nm/1300 nm/1310 nm/1490 nm/1550 nm/1625 nm/1650 nm |
Test Range | Type A: -65~+5dBm (standard);Type B: -40~+23dBm (optional) |
Resolution | 0.01 dB |
Accuracy | ±0.35 dBb ±1 nW |
Modulation Identification | 270/1k/2 kHz, input ≥ -40dBm |
Connector | FC/UPC |
Optical Laser Source (OLS) Module (Optional function) | |
Working Wavelength (±20nm) | 1310 nm /1550 nm/1625 nm3 |
Output Power | Adjustable -25~0 dBm |
Accuracy | ±0.5 dB |
Connector | FC/UPC |
Fiber Microscope (FM) Module (Optional function) | |
Magnification | 400X |
Resolution | 1.0 µm |
View of Field | 0.40 mm × 0.31 mm |
Storage/working Condition | -0.4 °F – 95 °F (-18 ℃ ~ 35 ℃) |
Dimension | 9.25 in x 3.74 in x 1.18 in (235 mm × 95 mm × 30 mm) |
Sensor | 1/3 inch 2 million of pixel |
Weight | 150 g |
USB | 1.1/2.0 |
Adapter | · SC-PC-F (For SC/PC adapter)
· FC-PC-F (For FC/PC adapter) · LC-PC-F (For LC/PC adapter) · 2.5PC-M (For 2.5mm connector, SC/PC, FC/PC, ST/PC) |
GENERAL SPECIFICATIONS | |
Display | 7 inch TFT-LCD with LED backlight (touch screen function is optional) |
Interface | 1×RJ45 port, 3×USB port (USB2.0,Type A USB×2, Type B USB×1) |
Power Supply | 10 V (dc), 100V(ac) to 240V(ac), 50~60Hz |
Battery | 7.4 V (dc)/4.4Ah lithium battery (with air traffic certification) |
Operating Time4 | 12 hours, Telcordia GR-196-CORE |
Charging time | <4 hours (power off) |
Power Saving | · Backlight off: Disable/1 to 99 minutes
· Auto shutdown: Disable/1 to 99 minutes |
Data Storage | Internal memory: 4 GB (about 40,000 groups of curves) |
Language | User selectable (English, Simplified Chinese, traditional Chinese, French, Korean,
Russian, Spanish and Portuguese -contact us for availability of others) |
Environmental Conditions | · Operating temperature and humidity: -10℃ ~+ 50℃ 95% (non-condensation)
· Storage temperature and humidity: -20℃ ~+ 75℃ 95% (non-condensation) · Proof: IP65 (IEC 60529) |
Dimension | 9.96 in x 6.61 in x 2.89 in (253 mm x 168 mm x 73.6 mm) |
Weight | 3.31 lbs. (1.5 kg) (battery included) |
Notes:
1Dynamic range is measured with maximum pulse width, averaging time is 3 minutes, SNR=1; The level difference between the RMS noise level and the level where near end back-scattering occurs. 2Event dead zone is measured with pulse width of 3 ns; attenuation dead zone is measured with pulse width of 5 ns. 31310 nm/1550 nm laser source uses OTDR 1 port, and 1625nm or 850 nm/1300 nm uses OTDR 2 port. 4Typical, backlight off, sweeping halted at 25℃, 12 hours typical continuous testing. |
Ordering Information
Module Number | Testing Wavelength (MM: ±20nm, SM: ±10nm) | Dynamic Range (dB) | Event/Attenuation Dead-zone (m) |
GAO-OTDR-115-A | 850/1300 nm | 19/21 dB | 0.8 m/ 4 m |
GAO-OTDR-115-B | 850/1300 nm | 19/21 dB | 0.8 m/ 4 m |
1310/1550 nm | 35/33 dB | 1 m/ 4 m | |
GAO-OTDR-115-C | 850/1300 nm | 19/21 dB | 0.8 m/ 4 m |
1310/1550 nm | 40/38 dB | 1 m/ 4 m | |
GAO-OTDR-115-D | 1310/1550 nm | 26/24 dB | 0.8 m/ 4 m |
GAO-OTDR-115-E | 1310/1550 nm | 32/30 dB | 0.8 m/ 4 m |
GAO-OTDR-115-F | 1310/1550 nm | 35/33 dB | 0.8 m/ 4 m |
GAO-OTDR-115-G | 1310/1550 nm | 40/38 dB | 1 m/ 4 m |
GAO-OTDR-115-H | 1310/1550 nm | 43/41 dB | 1 m/ 5 m |
GAO-OTDR-115-I | 1310/1550 nm | 45/43 dB | 1 m/ 5 m |
GAO-OTDR-115-J | 1310/1550/1625 nm (with optical filter) | 40/38/38 dB | 1 m/ 4 m |
GAO-OTDR-115-K | 1310/1550/1625 nm (with optical filter) | 43/41/41 dB | 1 m/ 5 m |
GAO-OTDR-115-L | 1310/1550/1625 nm (with optical filter) | 45/43/43 dB | 1 m/ 5 m |
GAO-OTDR-115-M | 1310/1550/1650 nm | 35/33/31 dB | 0.8 m/ 4 m |
GAO-OTDR-115-N | 1310/1490/1550 nm | 35/33/33 dB | 0.8 m/ 4 m |
Optional Features | |||
LS | Laser Source | ||
FM | Fiber Microscope | ||
PMa | Power Meter | TYPE A | |
PMb | TYPE B | ||
1 | Touch Screen | ||
2 | Waterproof | ||
3a | Connector | SC/UPC | |
3b | ST/UPC |
To order the product, please use the Module number GAO-OTDR-115-X.
‘X’ will be the module number for the wavelength and dynamic range variations.
To order the product along with the optional features, please use the Module number GAO-OTDR-115-X-Y-Z where “Y” & “Z” are the required optional features.
Packaging List
S.No. | Item Description | Quantity |
1 | Main OTDR unit | 1 |
2 | Power Adapter (220V 50 Hz) | 1 |
3 | Lithium battery | 1 |
4 | FC Adapter | 1 |
5 | USB Data Cable | 1 |
6 | CD disk | 1 |
7 | Carrying Case | 1 |
8 | User guide | 1 |
Optional Accessories
S.No. | Item Description |
1 | SC/ST/LC adapter |
2 | Bare fiber adapter |
Additional Information
Product Description
Main Menu Interface
OTDR Module Interface
VFL Module Interface
Preparation
1.1 Attaching the Belt:
Procedure:
1. Introduce belt through the buckle.
2. Put on the sheath.
3. Introduce belt through another buckle.
4. Fix the belt.
1.2 Connecting the Power Supply
Using AC adapter
Once connected to AC adapter, power indicator turns red (if it is not fully charged), the adapter is charging the battery after fully charged power indicator turns green.
Installing Battery
1 . Rotate buckle anticlockwise to open.
2. Install battery.
3. Close the cover, rotate buckle clockwise to close.
- Caution
-Proper charging temperature is: -10~50℃, high charging temperature may shorten battery life.
-Charging time is about 5 hours with power on, about 3 hours with power off.
-Don’t charge the battery more than 8 hours.
Turning on
Press power button(>2s) to turn on OTDR, power state indicator turns green .when power is low some warning information will display on the screen.
Power state indicator
-Green light: Working state or fully charged
-Red light: Charging state
-Launching state indicator
-Green light: Proceed real-time test
-Red light: Proceed averaging test
Connecting the Fiber
Before connecting fiber to GAO-OTDR-115, clean fiber end first, the dust which on the end of the connector may damage the optical port or reduce test quality.
Procedure:
1. Put connector against the cleaner.
2. Rotate the handle of cleaner.
3. Rub each other carefully to clean the contaminant.
4. Repeat procedure 1 and 3.
5. Open the protecting cover of the optical port.
6. Insect connector into optical port carefully.
Setting Measurement Conditions
Press 【SETUP】button on the panel to enter test setting interface. The meaning of items indicated in the following table:
Setting to Auto Mode
In Auto mode, you could just proceed test by setting proper wavelength.
Procedure:
1. Press【SETUP】button to enter “Test Setting” interface.
2. Set “Auto” mode.
3. Set test wave.
Setting to Manual Mode
In manual mode, user could set proper range and pulse width manually.
Procedure:
1.Press 【SETUP】button to enter “Test Setting” interface
2. Set “Manual” mode.
3.Set test wave.
4.Set range and pulse width.
Making Measurements
GAO-OTDR-115 has two test modes: averaging test mode and real-time test mode.
1. Averaging Test Mode: Averaging test mode can calculate the data of curve over a period of time and display as an averaging one, test time could set
“Test Time” in “Test Setting”.
Press【 TEST】 button on the control panel, test state indicator turns red, enter averaging test interface.
2. Real-time Test Mode: Real-time test mode could check network, adjust test range and pulse width in real-time.
Press 【REALTIME】 button on control panel, test state indicator turns green,enter realtime test interface.
Setting Wavelength
Procedure:
1. Select wavelength (WL) tag to set wavelength.
2. Confirm by 【OK】button.
Setting Test Range and Pulse Width
Procedure:
1. Select tag “Params” to set Test range(MR) and Pulse width(PW)button.
2. Confirm by 【OK】button.
Event List
After test, event list will appear immediately at the bottom of the window, user could get detail information about this test from the list.
Distance Measurement
Measure the distance from one point to another.
Procedure:
1. Press【F1】button to active cursor function.
2. Control 【】【】to move cursor A or B.
【◀】: move left 【▶】: move right
3. Get information by following the guide below:
Setting Proper Parameters
At the first time using OTDR, if the user chooses some testing parameter which is not suitable to the real condition may cause the bad result. The user should take Testing range, pulse width and wavelength into consideration.
Setting proper testing range
Testing range means maximum display range. This parameter will indicate how long will OTDR display on its screen. this range must longer than testing fiber, Usually, we choose a range which is 20% longer than testing fiber. Take note that testing range should not has a large difference with testing fiber, Otherwise, it will affect the effective resolution and overlarge testing range will result in the generation of huge and useless data(see Figure 1).
Setting proper pulse width
The pulse width and blind area, dynamic range are directly related to the maximum length, in below picture, use ten different pulse width to test one testing fiber. the smallest pulse width result in the smallest blind area and the most terrible noise. The longest pulse width results in the smoothest curve and almost 1km blind area (see Figure 2).
It is obviously at the top of testing fiber influence on Pulse width, in below chart, we cant detect the first connecting point located in the 540m by large pulse width (see Figure 3).
Dynamic range decided by Pulse width, the larger pulse width will spend more optical power, but it reaches further(see Figure 4).
Setting proper wavelength
Proceed test with same fiber but different wavelength we will get a different result. Longer the testing wavelength is, more sensitive of the bending, in the below chart, first splicing point has a bending problem, splicing loss value under 1550nm is bigger than that under 1310nm. the other points are similar with 1310nm and 1550nm. This phenomenon indicates that this fiber is just bent at the first point. If it’s possible please always compare the point state under 1310nm and 1550nm and judge whether it’s bent or squashed (see Figure 5).
Setting proper test time
In the averaging mode, long testing time could reduce noise during the data sampling and Improve precision to get a better and smoother curve (see Figure 6).
Expanding the Waveform and Moving the Display Area
1. Switching between Event List and Display Window
In “current test” interface, press【F4】button to switch between “Curve” and “Event”, expend each section after the switch, this function could also switch
between cursor(“Curve”) and selection tag(“Event”).
Procedure:
In test interface,
1. Press【F4】button to switch from curve to event windows.
2. Control【▶】/【◀】or【▲】/【▼】to move selection tag.
Every time move selection bar to an event in the event list, the cursor will move synchronously to the relevant event on a curve. The user could use Zoom”, “Move”, “Switch” function to adjust the curve to a better position.
2. Cursor Operation
Activating Cursor: In”Current Test” interface, press F1 button,”cursor”tag turns yellow, means it has been activated.
Moving Cursor: Set proper cursor, press【▶】/【◀】button to move current cursor, long press to move cursor faster.
Curve Operation
1.Horizontal Zoom:
Procedure:
In “Current Test”interface,
1. Press【F2】button to activate “Zoom”function.
2. Control【▶】/【◀】button to zoom in or zoom out curve.
【▶】: Zoom in curve 【◀】: Zoom out curve
2.Vertical Zoom
Procedure:
In “Current Test”interface,
1. Press【F2】button, activate “Zoom”function.
2. Control【▶】/【◀】button to zoom in or zoom out curve.
【▶】: Zoom out 【◀】:Zoom in
3. Press【OK】button to reset curve.
3.Horizontal Shift
Procedure:
In “Current Test”interface,
1. Press【F3】button, activate “shift “function.
2. Control【▶】/【◀】button to move right or left.
【▶】: move right 【◀】: move left
3. Press【OK】button to reset curve.
4.Vertical Shift
Procedure:
In “Current Test”interface,
1. Press【F3】button, activate “shift”function.
2. Control【▲】/【▼】button to move up or down.
【▲】move up: 【▼】move down.
3. Press【OK】button to reset curve.
Elaborating Event
This section we will introduce how to elaborate an event on curve, example as event 2 in right curve.
Procedure :
In “Current Test” interface,
1. Press【F1】button to activate cursor function.
2. Contro【▶】/【◀】lto move cursor(A or B) left or right.
3. Move to event 2.
4. Press【F2】button to active Zoom function.
5. Control【▶】button to zoom out event(cursor as the center).
6. Press【F3】button to activate”shift” function.
7. Control【▲】/【▼】/【▶】/【◀】button to adjust to a proper position.
Switching between Curves
This function could used to switch between several curves ,current curve displayed in yellow.
Procedure :
In “Current Test” interface,
1. Press【F2】button , active “switch”function.
2. Control【▲】/【▼】button to switch between curves.
【▲】:Switch to above curve 【▼】:switch to below curve
3. Press【OK】button to reset all curves
Removing Curve(s)
User could remove one or several curves.
Press 【F3】 “Overlay”tag menu:
Remove Current Trace Remove the Curve which has been selected.
Remove Other Trace Remove the Curve(s) which has not been selected.
Remove All Remove all the Curves.
Removing an Event
Adding an Event
Procedure:
In current Test interface,
1. Press【F1】button to activate tag, move cursor to the target event
2.Press【F5】button to select”Next Page”tag( Please refer last section5.6
“Remove an Event”).
3. Press【F3】 to add event.
File Operation
In “Current Test” interface Save the current curve, press FILE button on the board, open “File Operation” interface, showed as follow:
Saving Curve
Procedure:
In”Device Directory”window,
1. Press 【▲】/【▼】 to choose file and subfile then press 【OK】.
2. Press 【F5】button to enter “File Operation”interface ,user can change way of saving,decide way of naming and check
storage state.
3. Press【F2】 “Save” tag to save current curve as default name(set in “Filename Type”under “File Setting”interface).
4.If user want to change a name before saving , press【F3】”Save As”tag to input your ideal name(refer section “Entering
Characters” to learn how to input characters) and confirm by 【OK】button.
Loading Curve(s)
Procedure:
In”Device Directory”window,
1. Press 【▲】/【▼】to choose relative file and subfile press 【OK】.
2. Press【▶】 switch to “File list” window.
3. Control【▲】/【▼】 button to to select relevant file curve file(s),press 【OK】button to select the relevant file(s).
4. Press【F4】”Load” tag to load curve(s) .
Deleting Curve(s)
Procedure:
In “File Operation”interface,
1. Select the curve file(s) which you want to remove.
2. Press【F1】 “file operation” select “delete”sub menu to delete curve file(s).
Copying/Moving Curve(s)
Procedure:
In “File Operation”interface,
1. Select the curve file which you want to remove.
2. Press 【F1】”File operation” select “Cut” or “Copy”to move or copy curve file(s).
3. Choose the target folder, press【F1】 “File Operation” .
4. Select “Paste”tag to finish this operation.
File Setting
VFL Module
VFL module could launch visible light to identify the fiber, locate fault of SM or MM fibers. It is supplementary to the testing of blind area and basic tool of optical network, LAN, ATM fiber system and telecommunication network maintenance.
OPM Module(Optional)
User could use OPM module to measure the power value in optical network and get the loss of the line with optical light source.
OLS Module(Optional)
Fiber Microscope (FIM) Module(Optional)
FIM Module is qualified for field connector inspection by connecting a probe to USB port, also this probe can use computer as a display with no additional software.
Waterproofing work(Optional)
Through special process, GAO-OTDR-115 can compliance with IPX5 protection level. This could make GAO-OTDR-115 withstand harsher environments. Test for the ratings IPX5 address the possibility of water ingress from a jetting stream. They are conducted using a jet nozzle kit.
Touch Screen (Optional)
After selecting this optional module, a Resistance Screen will be added to FHO5000, user could select item or input words by just touch the relevant area, a specialized pen is attached.