GAOTek Spectrum Analyzer (9 kHz ~1.5 GHz, Phase Noise -85 dBc/Hz@10 kHz,DANL -150 dBm)

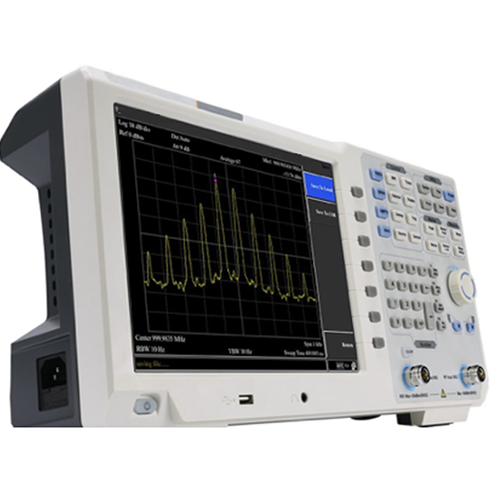
This Spectrum Analyzer (9 kHz ~1.5 GHz, Phase Noise -85 dBc/Hz@10 kHz, DANL -150 dBm) is a test equipment designed to examine the frequency spectrum of radio frequency with -150 dBm displayed average noise level.

GAO-SAU-103

Description

Overview

GAOTek Spectrum Analyzer (9 kHz ~1.5 GHz, Phase Noise -85 dBc/Hz@10 kHz, DANL -150 dBm) is a test equipment designed to examine the frequency spectrum of radio frequency (RF) with -150 dBm displayed average noise level. This device is used for locating, identifying, and solving problems in radio frequency circuits and equipment. The minimum resolution bandwidth of 10 Hz allows excellent signal resolution when separation of closely spaced signals is required and phase noise of -85 dBc/Hz enables users to evaluate most synthesizers and signal generators. It has a -150 dBm displayed average noise level which assures that the unit will not interfere with the actual data and can observe a weaker signal. It provides EMI filter and quasi-peak detector kit to help evaluating EMI levels for pre-compliance testing.

Features

  • Frequency Range from 9 kHz up to 1.5 GHz
  • -150 dBm Displayed Average Noise Level (DANL)
  • Phase Noise -85 dBc/Hz @1Gz and offset at 10 KHz
  • Total Amplitude Accuracy <1.5 dB
  • 10 Hz Minimum Resolution Bandwidth (RBW)
  • EMI Pre-compliance Test Kit
  • 5 GHz Tracking Generator Kit
  • 4 inches display

Technical Specifications

Frequency Specification
Frequency Range 9 kHz ~ 1.5 GHz
Frequency Resolution 1 Hz
Frequency Span
Frequency Range 0 Hz, 100 Hz to maximum frequency of device
Frequency Accuracy ± span/(swept points -1)
Internal Reference
Reference Frequency 10.000000 MHz
Reference Frequency Accuracy


± [(days from last calibrate × freq aging rate) + temperature stability + initial accuracy]
Temperature Stability < 2.5 ppm 59 °F to 95 °F (15 °C to 35 °C)
Aging Rate < 1 ppm / year
Readout
Marker Frequency Resolution


span/(the number of sweep points -1)
Uncertainty ± (freq indication × freq reference uncertainty +1%× span +10%× resolution bandwidth + Marker Frequency Resolution)
Frequency Counter
Resolution 1 Hz, 10 Hz, 100 Hz, 1 kHz
Accuracy ± (marker freq × freq reference uncertainty + counter resolution)
Bandwidth
Resolution Bandwidth (-3 dB) 10 Hz to 500 kHz (in 1 to 10 sequence), 1 MHz, 3 MHz
Resolution Filter Shape Factor < 5:1 nominal (Digital implement, similar to Gauss Pattern)
Accuracy < 5 % nominal
Video Bandwidth (-3 dB) 10 Hz to 3 MHz
Amplitude Specification
Amplitude Measurement Range


DANL to +20 dBm, close the preamplifier
Reference Electric Level -80 dBm to +30 dBm, 0.1 dBm steps
Preamplifier 20 dB, nominal, 9 kHz ~ 1.5 GHz
Input Attenuator Range 0 dB ~ 39 dB, 3 dB steps
Max Input DC Voltage 50 V DC
Max Continuous Power 30 dBm, average continuous power
Displayed Average Noise Level (DANL), Input Attenuation 0 dB, 1 Hz Resolution Bandwidth
Preamp Off 1 MHz to 10 MHz  -130 dBm (Typical)
10 MHz to 1 GHz  -130 dBm (Typical)
1 GHz to 1.5 GHz  -128 dBm (Typical)
Preamp On 1 MHz to 10 MHz  -150 dBm (Typical)
10 MHz to 1 GHz  -150 dBm (Typical)
1 GHz to 1.5 GHz  -148 dBm (Typical)
Phase Noise (68 °F ~ 86 °F (20 °C ~ 30 °C, fc=1 GHz))
Phase Noise <-85 dBc/Hz @10 kHz offset
<-100 dBc/Hz @100 kHz offset
<-110 dBc/Hz @1 MHz offset
Level Display Range
Log Scale Coordinate 1 dB ~ 255 dB
Linear Scale Coordinate 0 to reference level
Level Unit dBm,dBuW,dBpW,dBmV,dBuV, W,V
Points 201 ~ 1001
Number of Traces 5
Detectors Positive-peak, negative-peak, sample, normal, RMS
Trace Functions Clear write, Max Hold, Min Hold, View, Blank, Average
Frequency Response 68 °F ~ 86 °F (20 °C ~ 30 °C, 30 % – 70 % relative humidity, 20 dB input attenuation, reference 50 MHz)
Preamp Off ±0.8 dB
Preamp On ±0.9 dB
Accuracy
Input Attenuation Switching Uncertainty 68 °F ~ 86 °F (20 °C ~ 30 °C, fc=50 MHz, Preamplifier Off, 20 dB RF attenuation, input signal 0 dB ~ 39 dB
±0.5 dB
Absolute Amplitude Uncertainty 68 °F ~ 86 °F (20 °C ~ 30 °C), fc=50 MHz, RBW=1 kHz, VBW=1 kHz, peak detector, 20 dB RF attenuation,
Preamplifier Off ±0.4 dB, input signal= -20 dBm
Preamplifier On ±0.5 dB, input signal= -40 dBm
Uncertainty Input signal range 0 dbm to -50 dbm
±1.5 dB
VSWR Input 10 dB RF attenuation, 1 MHz ~ 1.5 GHz
<1.5, nominal
Distortion and Spurious Response
Second Harmonic Distortion fc ≥ 50 MHz, Preamp off, signal input -30 dBm, 0 dB RF attenuation, 68 °F ~ 86 °F (20 °C ~ 30 °C)
-60 dbc
Third-Order Intermodulation fc ≥ 50 MHz
+13 dBm
1 dB Gain Compression fc ≥ 50 MHz, 0 dB RF attenuation, Preamp off, 68 °F ~ 86 °F (20 °C ~ 30 °C)
+7 dBm, nominal
Residual Response Connect 50 Ω load at input port, 0 dB input attenuation, 68 °F ~ 86 °F (20 °C ~ 30 °C)
<-85 dBm, nominated
Input Related Spurious  -30 dBm signal at input mixer, 68 °F ~ 86 °F (20 °C ~ 30 °C)
< -60 dBc
Sweep Time and Triggering
Span Range 100 Hz ≤ SPAN ≤ 3 GHz 10 ms to 3000 s
zero sweep width 1 ms to 3000 s
Mode Continue, single
Trigger Free run, video, external
Tracking Generator
Output Frequency Range 100 kHz ~ 1.5 GHz
Output Power Level Range -30 dBm ~ 0 dBm
Output Power Level Resolution 1 dB
Output Flatness ±3 dB
Maximum Safe Reverse Level Average total power: 30 dBm, DC: ±50 V DC
Inputs and Outputs
Front Panel RF Input Connector 50 Ω, N-type female
Front Panel Track Generator Output 50 Ω, N-type female
10 M Reference Input 50 Ω, N-type female
Communication Port USB HOST, USB DEVICE, LAN, earphone port, and VGA
General Technical Specification
Display TFT LCD, 10.4 inches
Power 100 V – 240 V 50 Hz/60 Hz
Working Temperature 32 °F to 104 °F (0 °C to 40 °C)
Storage Temperature -4 °F to 140 °F (-20 °C to 60 °C)
Dimension (W × H × D) 16.57 in × 8.70 in × 4.52 in (421 mm × 221 mm × 115 mm)
Weight Approx. 10.93 lbs (4.96 kg)

Standard Accessories

Name Unit  
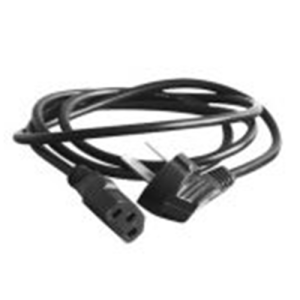
Power Cord 1  
CD ROM 1  
User’s Manual 1
N-N Cable (optional) 1  
N-SMA Cable (optional) 1  
SMA-SAM Cable (optional) 1  
SMA Adaptor (optional) 1  
N-SMA Adaptor (optional) 1  
Near Field Probe (optional) 1  

First Time to Power on

Connect the three-pin AC power cord into the instrument. Insert the plug into a power socket provided with a protective ground.

WARNING:
Check the power source before turning on the spectrum analyzer, to protect the device from damage.

  1. Press the power switch on the bottom left of the front panel.
  2. Self-initialization takes about 30 seconds, after the boot screen the spectrum analyzer will default to the scanning curve.
  3. After power on, let the spectrum analyzer warm up for 30 minutes for stabilization to obtain the most accurate results.

Front Panel

No. Description
LCD
Menu soft keys
Function keys
Knob
Arrow keys
RF Input connector
Unit keys
Numeric keypad
Tracking generator

output connector

Tracking generator

output On/Off button

Earphone interface
USB Host port
Power key

(Push to turn on,

long push to turn off)

Front Panel Function Key

Function Keys

Keys Description
Basic Keys
  Activates the center-frequency function, and accesses the frequency function menu.
  Activates the frequency sweep span function, and set Full SpanZero SpanLast Span.
  Activates the reference level function, and accesses the amplitude soft keys, with which you set functions that affect data on the vertical axis.
  Searches the signal automatically within the full frequency range.
Control Keys
  Activates the RBW (resolution bandwidth) function, and accesses the softkeys that control the bandwidth functions and averaging.
  Accesses the soft keys that allow you to store and manipulate trace information.
  Accesses the softkeys that allow you to configure detector functions.
  Accesses the softkeys that allow you to control what is displayed on the analyzer, including the display line, graticule and label.
  Accesses the softkeys that allow you to set the sweep time, select the sweep mode of the analyzer.
  Accesses the softkeys that allow you to select the trigger mode of the analyzer.
  Accesses the softkeys that allow you to set the tracking generator.
  Accesses the softkeys that allow you to set the demodulation.


Marker Measure Keys
  Places a marker on the highest peak, and accesses the Peak functions menu.
  Accesses the marker control keys that select the type and number of markers and turns them on and off.
  Accesses the marker function softkeys that allow you to set other system parameters based on the current marker value.
  Accesses the menu of special functions, such as noise marker, N dB bandwidth measure and frequency counting.
Advanced Measure Keys
  Accesses the softkeys that let you make transmitter power measurements such as ACPR (adjacent channel power), channel

power, and OBW (occupied bandwidth), etc.

  Sets the parameters for the selected measurement function.
Utility Keys
  Sets the system parameters, and accesses the calibration menu.
  Accesses the softkeys that allow you to configure the file system of the analyzer.
  Resets the analyzer to the factory settings or user state. This state can be specified in【System】→ [Power On/Preset ►]→ [Preset ►].
  Accesses the softkeys that allow you to set the print parameters.
  Accesses the softkeys that allow you to save current screen, trace data, or user state.
  Press the Help key to activate the help system. Press the Help key again to exit.

Parameter Input

Specific parameter values are able to be entered using the numerical keyboard, knob, and directional keys.

    Numeric Keyboard

  1. Numerical keys
    Numbers 0-9 are available to be used.
  1. Decimal point
    A decimal point “.” will be inserted at the cursor position when this key is pressed.
  1.  Sign key
    Sign key “+/-” is to toggle the sign of a parameter. When pressed the first time, a “-” will be inserted and changed into “+” following the second press.
  1. Unit keys
    Unit keys include GHz/dBm/s, MHz/dB/ms, kHz/dBmV/μs and Hz/mV/ns. After entering the desired numbers, choose an appropriate unit to complete the input. The specific meaning of unit is decided by the type of input parameter (“frequency”, “amplitude” or “time”).
  2. Cancel Key
    1. During the editing process, this key will clear the inputs in the active area and exit editing mode at the same time.
    2. Turn off the display in the active area.
    3. Exit current test mode while in keyboard test.
  3. Back Key
    During the process of parameter editing, this key will delete the characters on the left side of the cursor.While in the process of file name editing, pressing this key will delete characters that have been entered.
  4. ENTER KEY
    When pressed, the system will complete the input process and insert a default measurement unit for the parameter automatically

Knob

The knob function:

During parameter editing, turn the knob clockwise to increase, or counterclockwise to decrease the parameter values at specified steps.

Direction key

The directional keys have following functions:

  1. Increase or decrease the parameter value at specific steps while editing a parameter.
  2. Move the cursor though the directory tree in the 【File】

Rear Panel

No. Name Description
Handle Stow the handle for mobile use.
AC Power

Connector


AC: frequency 50 Hz±10%, single-phase alternative 220 V±15% or 110 V±15%
Stool To adjust the angle of the device
VGA Port Provides a VGA signal output which is used through a VGA cable or with a projector.
LAN Interface Through this interface, the analyzer can be connected to your local network for remote control. An integrated testing

system can be built quickly, as the analyzer conforms to the LXI C Device class instrument standards.

USB Device

Interface


This configurable USB port permits external USB devices. It supports printer and remote-control connection.
10MHz

IN/OUT

The BNC input or output of the 10 MHz reference clock.
Lock Hole You can lock the spectrum analyzer to a fixed location using the security lock

(please buy it yourself) to secure the spectrum analyzer.

 User Interface

No. Name Description Related Key
Amplitude

Division Type


Can choose logarithmic

or linear


【AMPTD】→

[Scale Type]

Amplitude

Division


Display division scale 【AMPTD】→

[Scale/Div]

Reference Level


Reference level 【AMPTD】→

[Ref Level]

Detection Type Display detection type 【Detector】


Attenuation Display input attenuation setting


【AMPTD】→ [Attenuation]
Marker Display current activated marker 【Marker】
Date/Time Display system date and time 【System】→

[Date/Time]

⑧⑨ Marker Readout Display frequency and amplitude of current marker 【Marker】
Menu Item Menu item of current

function


Menu Title Function of current menu belongs to
LAN Access

Sign

LAN access sign
USB Storage

Device


Shows if USB storage

device is inserted


Temperature

Sign


Displays device internal temperature


Sweep Time System sweep time 【Sweep】→

[Sweep Time]

Span Displays span width 【SPAN】→

[Span]

Video

Bandwidth


Displays video bandwidth 【BW】→ [VBW]
Center

Frequency


Displays center frequency 【FREQ】→

[Center Freq]

Resolution

Bandwidth


Displays resolution

bandwidth


【BW】→[RBW]
System Status Displays spectrum

analyzer status


 Built-in Help

The built-in help provides information that refers to every function key and menu key on the front panel. Users can view this help information if required.

  1. How to acquire built-in help
    Press Help; a prompt about how to obtain help information will be shown.
  2. Page up and down
    If there is more than one page of information, you can read the complete information by using the directional keys.
  3. Close the current help information
    Press “Help” again to close help.
  4. Acquire the menu help
    A message about how to obtain help information will be shown, press the menu keys to get the corresponding help.
  5. Acquire the help information of any function key
    A message about how to obtain help information will be shown, press any function key to get the corresponding help.

Basic Measurement

 Basic measurements include, input signal frequency and amplitude display, marked by a frequency marker. Follow these four simple steps below to implement input signal measurement.

Basic:

  1. Set the center frequency
  2. Setup span and resolution bandwidth
  3. Activate the marker
  4. Setup amplitude

For example, to measure a 100 MHz -20 dBM signal you must turn on the spectrum analyzer and ensure it is warmed up for 30 minutes to ensure measurement accuracy.

  1. Equipment connection:
    Connect the signal generator to the spectrum analyzer input terminal and set the parameters as follows:
    Frequency: 100 MHz; Amplitude -20 dBm
  2. Setup parameters:
    1)Press “Preset” to reset the spectrum analyzer to factory settings.
    The Spectrum analyzer will display the spectrum from 9 kHz to the maximum span width. The signal generated will display as a vertical line at 100 MHz.To clearly observe the signal, reduce the span width to 1 MHz and set the center frequency to 100 MHz.

    2)Setup the Center Frequency
    Press “FREQ”, select [Center frequency] on corresponding pop up menu. Input “100” and select the unit as MHz on the numerical keyboard. The keys can be used to set the exact value but the knob and directional keys can also be used to set the center frequency.
    3) Setup span
    Press 【SPAN】, input “1” and select unit MHz on the numerical keyboard or Press 【↓】to decrease to 1 MHz.
    Press 【BW】, set [resolution bandwidth] to manual, and input “30” on the numerical keyboard and select the unit as kHz or press 【↓】to decrease to 30 kHz.
    Press 【Detector】, set the detection type to positive peak.

Figure shows the signal at a higher resolution.
Please note that resolution bandwidth, video bandwidth and span are self-adapted. They adjust to certain values according to sweep width. Also, sweep time can be self-adapted.

Activate Marker

  • Press the Marker button in the function area. Press the soft key to select [Marker 12 3 4 5], select Marker 1, the marker is located at horizontal center by default, that is the signal peak point or its neighbor.
  • Press Peak, and enter the next level menu, select [Max Search]. Frequency and amplitude values are read by the marker and shown on the top right of the display area.

Setup amplitude

The reference level will be shown at the top of the display grid. To get a better dynamic range, the real signal peak point should be located at or near the top of display grid (reference level). The reference level is also the maximum value on Y axis. Here we reduce to 20 dB reference level to increase the dynamic range.

Press 【AMPTD】, the amplitude setting menu will pop up, and the [reference level] soft key will be activated. The reference level can be input at the top left of the display grid. Input “-20” using the numerical keyboard and set the unit to dBm. You can also use the 【↓】key or the knob for adjustment.

The reference level is set at -20 dBM, which is the signal peak value near the top of the grid. The balance between the signal peak value and noise is dynamic range.

Menu Interpretation

FREQFrequency

The frequency range of a channel can be expressed by either of two groups of parameters: Start Frequency and Stop Frequency; or Center Frequency and Span. If any such parameter is changed, the others would be adjusted automatically in order to ensure the coupling relationship among them.

[Center Freq]

Sets the center frequency of the sweep. When pressed, the frequency mode is switched to Center Freq and Span in order to enter the desired parameter data.

[Start Freq]

Sets the start frequency of the sweep. When pressed, the frequency mode is switched to Start Freq and Stop Freq in order to enter the desired parameter data.

[Stop Freq]

Sets the stop frequency of the sweep. When pressed, the frequency mode is switched to Start Freq and Stop Freq in order to enter the desired parameter data.

[CF Step Auto Manual]

Sets the step of center frequency. Changing the center frequency in a fixed step continuously switches the channel to be measured.

[Freq Offset]

You can set a frequency offset to displayed frequency value, including freq marker value. This movement won’t influence sweep frequency range. While this function activated (frequency offset isn’t 0), you can modify this parameter using the numeric keys, knob or direction keys.

[Freq Ref Internal External]

Set the reference frequency as internal or external input, this is regarded as whole device reference.

SPAN

Set the spectrum analyzer to span mode. When pressed, 【SPAN】, [Span],[Full Span],[Zero Span] and [Last Span] will be available to configure. You can modify span using the numeric keys, knob or direction keys. Use numerical key or [Zero Span] to clear span.

[Span]

Sets the frequency range of the sweep. When pressed, the frequency mode is switched to Center Freq/Span.

[Full Span]

Sets the spectrum analyzer to center frequency/sweep mode, and span of the analyzer to the maximum.

[Zero Span]

Sets the span of the analyzer to 0 Hz. Both the start and stop frequencies will equal the center frequency and the horizontal axis will denote time. The analyzer here is measuring the time domain characteristics of amplitude, located at the corresponding frequency point. This will help to observe the signal (especially for modulated signal) at time domain.

[Last Span]

Changes the span to the previous span setting.

AMPTDAmplitude

Sets the amplitude parameters of the analyzer. Through these parameters, signals under measurement can be displayed at an optimal view with minimum error. The pop out amplitude menu includes [Ref Level], [Attenuation Auto Manual], [Scale/Div], [Scale Type Lin Log], [Ref Offset], [Ref Unit], and [Preamplifier On Off].

[Ref Level]

Activate reference level function and sets the maximum power or voltage for display window.

[Attenuation Auto Manual]

Sets the front attenuator of the RF input in order to permit big signals (or small signals) to pass from the mixer with low distortion (or low noise). It only works under internal mixer mode to adjust input attenuator insider analyzer. In Auto mode, input attenuator is related with reference level.

Note:

Maximum input signal amplitude of input attenuator (10 dB input attenuation at least) is +27 dBm, higher power signal will damage input attenuator or mixer.

[Scale/Div]

Sets the logarithmic units per vertical grid division on the display. Select 1,2,4 or 10dB log amplitude scale. It’s 10dB/div by default. Every activated marker is with dB as unit, difference between two markers is treated as marker difference under dB unit.

[Scale Type Lin Log]

Sets the Scale Type of Y-axis to Lin or Log, the default is Log. It only works under internal mixer mode. In general, select mV as Lin amplitude scale unit. Of course there would be other units for select.

[Ref Offset]

Assigns an offset to the reference level to attempt to compensate for gains or losses generated between the device under measurement and the analyzer.

[Ref Unit►]

Sets the unit of the Y-axis to[dBm], [dBmV], [dBuV], [V] or [W].

[Preamplifier On Off]

Sets the status of preamplifier located at the front of the RF signal path. Turning on the preamplifier reduces the displayed average noise level in order to distinguish small signals from the noise when working with small signals.

AutoAuto Tune

Searches for signals automatically thrughout the full frequency range, adjusts the frequency and amplitude to their optimum and realizes one-key signal search and auto setting of parameters.

BWBandwidth

Sets the RBW (Resolution Bandwidth) and VBW (Video Bandwidth) parameters of the analyzer. Pop out the setting menu includes [RBW Auto Manual], [RBW Mode Default Continuous], [VBW Auto Manual], [Average On Off], [EMI BW►].

[RBW Auto Manual]

Adjust the resolution bandwidth ranging from 10 Hz -3 MHz. Use numerical key, step key or knob to switch resolution bandwidth. The underline under Auto or Manual means Auto mode or Manual mode. Press [Resolution Bandwidth Auto Manual] and hold it until underline under Auto has been highlighted. Then the resolution bandwidth is under auto coupling mode.

[VBW Auto Manual]

Sets the desired video bandwidth in order to remove the band noise. Set the video resolution displays in function area, ranging from 10 Hz to 30 MHz by sequence step. You can modify this parameter by numeric key, step key or knob. The underline under Auto or Manual means Auto mode or Manual mode. Press [VBW Auto Manual] and hold it in manual until the underline highlighted under Auto to return auto mode.

Trace

As the sweep signal is displayed as a trace on the screen, you can set parameters about the trace using this key. The analyzer allows for up to five traces to be displayed at one time, and press this key to check the menu for trace. It includes [Trace 1 2 3 4 5], [Clear Write], [Max Hold], [Min Hold], [Blank], [Check], [ 1 ↔ 2], [ 2 -DL → 2], [2 ↔ 3], [ 1 → 3] and [ 2 → 3].

Detector

While displaying a wider span, each pixel contains spectrum information associated with a larger subrange. That is, several samples may fall on one pixel. Which of the samples will be represented by the pixel depends on the selected detector type. Press this key to pop out the relevant menu includes [Auto], [Normal], [Pos Peak], [Neg Peak], [Sample].

Detector type comparison

Detector Type Measurement
Auto Normal wave detect is the most common way to detect waveform. It can observe the signal and base noise at the same time without

loosing any signal.

Normal Display pos peak and neg peak alternately when noise is detected, or it only display pos peak.
Pos Peak Positive peak detection ensures that no peak signal is missed, which is useful for measuring signals that are very close to the base noise.
Neg Peak Negative peak detection is used in most cases with the self-test of the spectrum analyzer and is rarely used in the measurement. It is able to

restore the modulation envelope of the AM signal well.

Sample Sampling detector is conducive to

measurement noise signal. Compared with the standard detection method, it can measure

noise better.

Display

Controls the screen display of the analyzer, such as setting the on or off for window zoom, display line, amplitude scale, grid, label, and display style.

Sweep

Sets parameters about the Sweep time and mode including [Sweep Time

Auto Manual]. [Sweep Single], [Sweep Cont]].

Trig

Sets the trigger type and other associated parameters, menu includes [Auto

Run] and [Video].

Source

When the Source is On, a signal with the same frequency of the current sweep signal will be output from the GEN OUTPUT 50Ω terminal on the front panel. Press the key will pop out related menu includes [Tracking Source►], [Tracking Source On Off], [Output Power], [Network Measure►]. The tracking source is turned off in the power-on and reset states.

DemodDemodulation

Enter the demodulation settings, the spectrum analyzer supports audio demodulation and AM, FM digital demodulation.

Peak

Executes peak searching immediately and opens the Peak setting menu.

Marker

The marker appears as a rhombic sign (shown below) for identifying the point on the trace. We can easily readout the parameters of the marked point on the trace, such as the amplitude, frequency and sweep time.

Marker→

A soft menu associated with the marker function is popped out for setting the other system parameters (such as Center frequency, Reference level) by current marker readings. These menus relate to the frequency of the spectrum analyzer, whether the sweep width and marker are in normal or delta marker mode.

Marker FctnMarker Function

Executes specific marker soft menu.

MeasMeasurement

Provide a variety of advanced measurement functions, pop-up spectrum analyzer built-in and user-defined measurement function soft menu, turn on or off the time spectrum, adjacent channel power measurement, channel power measurement, occupied bandwidth, Pass-Fail measurement menu.

Meas Setup

Measurement setting menu for the corresponding measurement parameter settings when adjacent channel power, channel power, occupied bandwidth measurement mode is turned on.

System

A soft menu for system parameter settings pops up. Including [System Info►], [Configure I / O ►], [Power On / Reset ►], [Local Language►], [Date / Time►], [User Calibration►], [System Service►]. For first time you use the spectrum analyzer, set the date and time, the system will store the settings, restart the machine after power off won’t change the settings.

File

Pop up file management soft menu.

Print

Pop out the relative soft menu for printing.

Save

It’s available to save screenshot, trace data, or user status.

Troubleshooting

Power on malfunction
Power on malfunction can include a situation where the screen is still dark (no display) after switched on.
If the screen is still dark after power on, please check:

  • If the power supply has been connected correctly and if the power supply voltage range is within the specification.
  • If the power switch has been turned on.
  • If the fan is running, please contact GAOTek for service

No signal display

If there is no signal display at any wave band. Please try the following: set a signal generator at 30 MHz frequency and -20 dBm power and connect it to the spectrum analyzer RF input connector. If there is still no signal display, there may be a problem with the spectrum analyzer hardware circuit.

Wrong measurement results or poor signal frequency precision.

If the display contents shakes a lot or the frequency readout exceeds the error range during measurements, check if the signal source is stable. If so, check if spectrum analyzer reference is precise. Select internal or external frequency reference according to measurement conditions: press 【FREQ】→ [frequency reference Internal External]. If the frequency is still not precise, then the spectrum analyzer LO has lost its phase lock.

Wrong measurement results or poor readout amplitude precision

If signal amplitude readout is not precise, perform a calibration. If amplitude readout is still not precise, then it may be a problem with internal circuit, please contact the supplier for service.

General Care
Do not store or leave the instrument where the liquid crystal display could be exposed to direct sunlight for long periods of time.

Caution:

To avoid any damage to the instrument or probes, do not expose it to any sprays, liquids, or solvents.

Cleaning

Inspect the instrument and probes as often as operating conditions require.
To clean the instrument exterior, perform the following steps:
Wipe the dust from the instrument surface with a soft cloth. Take care not to scratch the transparent LCD protection screen when cleaning